Palumbo Antonio, MD Research Support/P.I. No relevant conflicts of - - PowerPoint PPT Presentation

palumbo antonio md
SMART_READER_LITE
LIVE PREVIEW

Palumbo Antonio, MD Research Support/P.I. No relevant conflicts of - - PowerPoint PPT Presentation

Disclosures for Palumbo Antonio, MD Research Support/P.I. No relevant conflicts of interest to declare Employee No relevant conflicts of interest to declare Amgen, Bristol-Myers Squibb, Celgene, Janssen, Consultant Millenium, Onyx Major


slide-1
SLIDE 1

Disclosures for Palumbo Antonio, MD

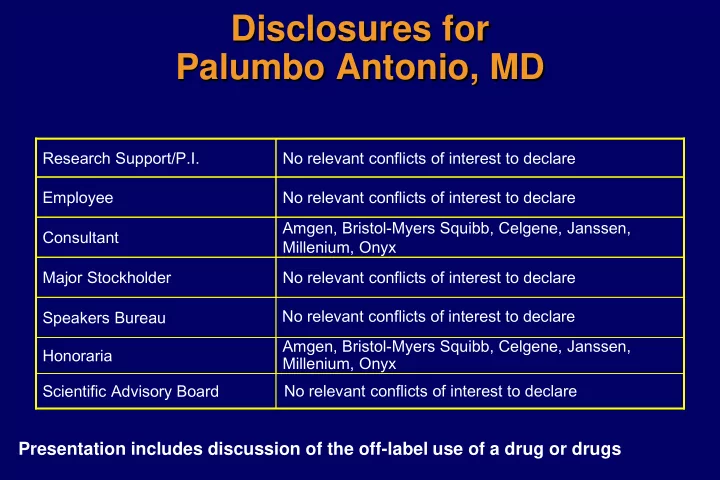
Amgen, Bristol-Myers Squibb, Celgene, Janssen, Millenium, Onyx Honoraria Scientific Advisory Board Speakers Bureau No relevant conflicts of interest to declare Major Stockholder Amgen, Bristol-Myers Squibb, Celgene, Janssen, Millenium, Onyx Consultant No relevant conflicts of interest to declare Employee No relevant conflicts of interest to declare Research Support/P.I. No relevant conflicts of interest to declare No relevant conflicts of interest to declare

Presentation includes discussion of the off-label use of a drug or drugs

slide-2
SLIDE 2

Antonio Palumbo, MD

University of Torino Torino, Italy

Status of the art of treatment

slide-3
SLIDE 3

Biological events

Korde N, et al. Blood. 2011;117: 5573-81.

Normal Pregerminal B cells Precursor disease Multiple myeloma Extramedullary myeloma

Clinical Phase

Primary IgH translocations Hyperdiploidy Cyclin D gene dysregulation Deletion of chromosome 13 NRAS mutation KRAS and FGFR3 mutations MYC up-regulation MYC rearrangement p18, p53 and Rb gene inactivation

NDMM: 5286 substitutions RRMM: 12581 substitutions

slide-4
SLIDE 4

Early or late intervention

Sensitive disease

  • 5-year PFS: 67%
  • 5-year OS: 73%

Resistant disease

  • Median PFS: 5 mo
  • Median OS: 9 mo

Normal pre-germinal B cells Precursor disease Multiple myeloma Extramedullary myeloma Increasing genetic and epigenetic abnormalities1

  • 1st Tx 100; - 2nd Tx 60; - 3rd Tx 35; - 4th Tx 20; - 5th Tx 10
slide-5
SLIDE 5

Progenitors Cells - Antigen Escape

CDxx CDxx?? CDxx??

slide-6
SLIDE 6

Early vs Late ASCT

791 patients

Gay F. et al manuscript in preparation

PFS MEL200 High Risk CC Standard Risk

slide-7
SLIDE 7

Clonal evolution

Patients (%) Time

0.00 0.25 0.50 0.75 1.00

5 10 15 20 25

0.00 0.25 0.50 0.75 1.00

5 10 15 20 25

Spontaneous clonal evolution Drug-related clonal evolution

slide-8
SLIDE 8

Continuous vs Fix duration

Meta-analysis of 3 studies: 1218 patients

P F S 1 P F S 2 O S N= 1218

N= 687 2nd P F S

Median CT 32 mos FDT 16 mos Months % of patients

PFS1 PFS2 1-year Landmark analysis

HR 0.61, 95% CI 0.50-0.75, P <.001

12 24 36 48 60 Median CT 55 mos FDT 40 mos Months

CT, continuous therapy; FDT, fixed duration of therapy; PFS, progression-free survival; mos, months.

25 50 75 100 25 50 75 100 12 24 36 48 60

HR 0.47, 95% CI 0.40-0.56, P <.001 Palumbo A, et al. JCO 2015 in Press Ind. Maintenance Ind. Maintenance

slide-9
SLIDE 9
  • Young patients treated with CC
  • Young patients treated with ASCT

P < 0.001 HR 0.19 No maint No maint

Progression-free survial 12-months landmark analysis

0.00 0.25 0.50 0.75 1.00 10 20 30 40 50

Months

0.00 0.25 0.50 0.75 1.00 10 20 30 40 50

No maint Maint No maint Maint

MEDIAN PFS: NA vs 30.8 months MEDIAN PFS: NA vs 13.2 months

P 0.02 HR 0.22 P < 0.001 HR 0.19

Months Months Probability Probability

Maintenance vs no Maintenance in 1964 CR patients

Cerrato C et al AH 2015

slide-10
SLIDE 10

Tumor load during maintenance according to mainteneance (no relapsed patients included)

Absolute PC in maint in CRD (no relapsed pz) (assessed by flow cytometry)

D i a g n

  • s

i s p r e

  • m

a i n t e n a n c e + 3 m a i n t e n a n c e + 6 m a i n t e n a n c e + 1 2 m a i n t e n a n c e + 1 8 m a i t e n a n c e 0.1 1 10 100 1000 10000

PC/uL

slide-11
SLIDE 11

Complete Response

slide-12
SLIDE 12

1 10-1 10-2 10-3 10-4 10-5 10-6 10-7 1 2 3 4 5

Serum tools RQ- PCR

“cure”

Immunophenotype NEXT-GENERATION SEQUENCE

MRD sensitivity

slide-13
SLIDE 13

MRD: bone marrow only? NO

  • CT/PET positive in 29% of CR patients
  • PET/CT

sensitivity of 50.0 % specificity of 85.7 %,

  • verall accuracy of 74.2 %.
  • MRI

sensitivity of 80.0 %, specificity of 38.1 %,

  • verall accuracy of 51.6 %.

Zamagni E. et al, Clin Cancer Res. 2015;21(19):4384 p = 0.02 89.6% 54.5%

PFS: VRD vs MEL200

negative PET-CT and MRD (47.7% of patients)

Moreau et al – ASH2015

slide-14
SLIDE 14

Young patients

slide-15
SLIDE 15

Induction regimen Schedule

Bortezomib-Cylophosphamide- Dexamethasone2

28-day cycles Bor: 1.3 mg/m2 d 1-4-8-11 Cycl: 300 mg/m2 d 1-8-15-(22) Dex: 40 mg d 1, 8, 15, 22

Bortezomib-Doxorubicin- Dexamethasone3

28-day cycles Bor: 1.3 mg/m2 d 1-4-8-11 Dox: 9 mg/m2 d 1-4

  • Dex. 40 mg d 1, 8, 15, 22

Bortezomib-Thalidomide- Dexamethasone4

21-day cycles Bor: 1.3 mg/m2 d 1-4-8-11 Thal: 100 - 200 mg/d Dex: 40 mg, d 1-4, 9-12

Bortezomib-Lenalidomide- Dexamethasone5

28-day cycles Bor: 1.3 or 1 mg/m2 d 1-4-8-11 Len: 15 or 25 mg d 1-21 Dex: 40 mg d 1, 8, 15, 22

Three Drug Regimens

2Khan ML, et al. Br J Haematol. 2012;156(3):326-333; 3Sonneveld P, et al. J Clin Oncol. 2012;30(24):2946-5295; 4Cavo M, et al. Lancet.

2010;376(9758):2075-2085; 5Richardson PG, et al. Blood 2010; 116(5):679-686.

slide-16
SLIDE 16

Consolidation Improves Response

Percentage

1 2 1 3

10 20 30 40 50 60 70 80

TD2 VTD2 VTD1 R5

before after

CR: 15%  49% CR: 40%  47% CR: 49%  61% ≥VGPR: 58%  69%

before after before after before after

V3

(n)CR: 20%  45%

before after

VTD4

CR: 33%  52%

before after

V:Bortezomib T:Thalidomide D:Dexamethasone R:Lenalidomide

1 Ladetto M, et al. J Clin Oncol. 2010;28(12):2077-2084. 2 Cavo M, et al. Blood. 2012;120(1):9-19. 3. Mellqvist UH, et al. Blood. 2013;121(23):4647-4651; 4. Leleu X, et al. Leukemia. 2013;27(11):2242-2244 5 Attal M, et al. N Eng J Med 2012;366(19):1782-1791

slide-17
SLIDE 17

Sequential treatment

V, bortezomib; C, cyclophosphamide; D, dexamethasone; MEL200, melphalan 200 mg/m2 ; R, lenalidomide

VCD

Four 21-day courses V: 1.3g/m2, d 1,4,8,11 C: 500 mg/m2, d 1,8 D: 40 mg, d 1,4,8,11

MEL200

Two courses M: 200 mg/m2 day -2 Stem cell support day 0

VRD

Four 28-day course V: 1.3 mg/m2 d 1,4,8,11 R: 25 mg/day, d 1- 21 D: 40 mg, d 1,4,8,11

T R A N S P L A N T A T I O N C O N S O L I D A T I O N M A I N T E N A N C E

R

Maintenance L: 10 mg/day on days 1-21

slide-18
SLIDE 18

Newly diagnosed multiple myeloma patients eligible for autologous transplantation (ASCT) N= 425 Endpoints:

  • Primary: VGPR
  • Secondary: ORR,

DoR, TTNT, OS, MRD Arm A: CRd

  • Carfilzomib 36 mg/m2 IV Days 1, 2, 8, 9,

15, 16

  • Lenalidomide 25mg/day Days 1 - 21
  • Dexamethasone 20mg PO Days 1, 2, 8, 9,

15, 16, 22, 23

Arm A: CRd

  • Carfilzomib 36 mg/m2 IV Days 1, 2, 8, 9, 15,

16

  • Lenalidomide 25mg/day Days 1 - 21
  • Dexamethasone 20mg PO Days 1, 2, 8, 9,

15, 16, 22, 23

Arm B: CCyd

  • Carfilzomib 20/36 mg/m2 IV Days 1, 2, 8,

9, 15, 16

  • Cyclophosphamide 300mg/m2 Days 1, 8,

15

  • Dexamethasone 20mg PO Days 1, 2, 8, 9,

15, 16, 22, 23

Arm B: CCyd

  • Carfilzomib 36 mg/m2 IV Days 1, 2, 8, 9,

15, 16

  • Cyclophosphamide 300mg/m2 Days 1, 8,

15

  • Dexamethasone 20mg PO Days 1, 2, 8, 9,

15, 16, 22, 23

Study Schema:

One cycle = 28 days

Italian KRd study design

Arm C: CRd

  • Carfilzomib 36 mg/m2 IV Days 1, 2, 8, 9, 15, 16
  • Lenalidomide 25mg/day Days 1 - 21
  • Dexamethasone 20mg PO Days 1, 2, 8, 9, 15, 16, 22, 23

Induction (4 cycles) Consolidation (4 cycles)

Lenalidomide 10mg Days 1- 21

Maintenance One cycle = 28 days

Lenalidomide 10mg Days 1- 21 Carfilzomib 27 mg/m2 IV Days 1, 2, 15, 16

R R

To Progression or Intolerance

A S C T

Total 12 Cycles

One cycle = 28 days

MRD (M4) MRD (M12) MRD (q6Mo) MRD (M0)

slide-19
SLIDE 19

Daratumumab trial in transplant eligible NDMM Hovon/IFM VTD + Dara Dara

Courtesy P Sonneveld

Observation Induction 4 cycles MaintenanceUntil progression Endpoints:

  • sCR
  • PFS, OS

VTD

R

HDM ASCT

Stratify by: dara treatment, response, MRD status

R

VTD + Dara VTD Consolidation 2 cycles

slide-20
SLIDE 20

Elderly patients

slide-21
SLIDE 21

VMP (Bortezomib/Melphalan/Prednisone) Current Standard of Care

Median TTP VMP: 24.0 months (83 events) MP: 16.6 months (146 events) HR=0.483, P < .000001 3 6 9 12 Time (Months) 15 18 21 24 27 10 20 30 40 50 60 70 80 90 100 Percentage of Patients Without Event VMP MP Percentage of Subjects Without Event Time (Months) 2 4 6 8 10 12 14 16 18 20 22 24 26 28 30 32 34 36 38 40 10 20 30 40 50 60 70 80 90 100 Median follow-up 25.9 months Median OS not reached VMP: 3-year OS rate = 72% MP: 3-year OS rate = 59% HR = 0.644, P = .0032 VMP MP

~52% reduced risk of progression ~36% reduced risk of death

San Miguel JF, et al. ASH 2008. Abstract 650.

slide-22
SLIDE 22

FIRST Trial: TTP and Time to 2nd Anti-myeloma Therapy

Facon T, et al. Blood. 2013;122:abstract 2.

Rd Rd18 MPT 535 541 547 398 389 379 318 317 303 263 265 242 218 167 169 167 108 115 105 56 58 55 30 28 19 7 6 2 2 1

TTP (months) Patients (%) 100 80 60 40 20 6 12 18 24 30 36 42 48 54 60 Hazard ratio Rd vs. MPT: 0.68; P=0.00001 Rd vs. Rd18: 0.62; P≤0.00001 Rd18 vs. MPT: 1.11; P=0.21718

Time to Progression Time to 2nd AMT

Rd Rd18 MPT 535 541 547 445 451 422 371 375 351 319 331 293 275 266 239 224 181 177 142 111 101 77 61 42 28 16 9 3 2 1

Time to 2nd AMT (months) 100 80 60 40 20 Hazard ratio Rd vs. MPT: 0.66; P<0.00001 Rd vs. Rd18: 0.74; P=0.00067 Rd18 vs. MPT: 0.88; P=0.12333 6 12 18 24 30 36 42 48 54 60 Patients (%) Median TTP Rd (n=535) 32.5 mos Rd18 (n=541) 21.9 mos MPT (n=547) 23.9 mos Median Time to 2nd AMT Rd (n=535) 39.1 mos Rd18 (n=541) 28.5 mos MPT (n=547) 26.7 mos

22

slide-23
SLIDE 23

VRd vs Rd in NDMM

Durie et al ASH 2015

slide-24
SLIDE 24

Salvage therapy

slide-25
SLIDE 25

Induction regimen Schedule

Bortezomib- Dexamethasone1

21-day cycles Bor: 1.3 mg/m2 , d 1-4-8-11 Dex: 40 mg, d 1-4, 9-12

Lenalidomide- Dexamethasone6

28-day cycles Len: 25 mg d 1-21 Dex: 40 mg d 1, 8, 15, 22

Two Drug Regimens

1Harousseau JL, et al. J Clin Oncol. 2010;28(30):4621-4629; 6Rajkumar V, et al. Lancet Oncol 2011; 116(5):679-686.

slide-26
SLIDE 26

MM-003: POM-Dex vs Dex in Relapsed MM

a Based on IMWG criteria.

San-Miguel JF, et al. J Clin Oncol. 2013;31(Suppl): Abstract 8510. Proportion of Patients

Median OS POM + LoDEX (N = 302) 12.7 mos HiDEX (N = 153) 8.1 mos

0.0 0.2 0.4 0.6 0.8 1.0 4 8 12 20 16 Months

HR = 0.74 P = .028

Pomalidomide 4 mg orally d 1–21 of 28-day cycels Dexamethasone 40 mg d 1, 8, 15, 22

Months

Progression-free survival Overall survival

slide-27
SLIDE 27

1.0 0.8 0.6 0.4 0.2 0.0 KRd Rd 6 12 18 24 30 36 42 48

ASPIRE: Carf-Len-Dex vs Len-Dex in Relapsed MM

Stewart KA, et al. NEJM. 2015;372:142

Carfilzomib 27 mg/m2 IV d 1,2,8,9,15,16 (20 mg/m2 d 1,2 cycle 1) Lenalidomide 25 mg d 1-21 Dexamethasone 40 mg d 1, 8, 15, 22

Progression-free survival Overall survival

Months Months

1.0 0.8 0.6 0.4 0.2 0.0 6 12 18 24 30 36 42 48 KRd Rd

Median PFS KRd (N = 396) 26.3 mos Rd (N = 396) 17.6 mos

HR 0.69 P <0.001

Median OS KRd (N = 396) NE Rd (N = 396) NE

HR 0.79 P =0.04

KRd, carfilzomib-lenalidomide-dexamethasone; Rd, lenalidomide-dexamethasone; NE, not estimable; PFS, progression-free survival; OS, overall survival

slide-28
SLIDE 28

Number of patients at risk: IRd Placebo-Rd 360 345 332 315 298 283 270 248 233 224 206 182 145 119 111 95 72 58 44 34 26 14 9 1 362 340 325 308 288 274 254 237 218 208 188 157 130 101 85 71 58 46 31 22 15 5 3

1.0 0.8 0.6 0.4 0.2 0.0 1 2 3 4 5 6 7 8 9 10 11 12 13 14 15 16 17 18 19 20 21 22 23 24 Probability of progression-free survival Time from randomization (months) Log-rank test p=0.012 Hazard ratio (95% CI): 0.742 (0.587, 0.939) Number of events: IRd 129; placebo-Rd 157

Median PFS: IRd: 20.6 months Placebo-Rd: 14.7 months

Median follow-up: ~15 months Moreau et al ASH 2015

Ixazomib: 4 mg on days 1, 8, and 15 Lenalidomide: 25 mg* on days 1-21 Dexamethasone: 40 mg on days 1, 8, 15, 22

Oral Ixazomib, Lenalidomide Dexamethasone (Ird) in RRMM myeloma

slide-29
SLIDE 29

1. Hsi ED et al. Clin Cancer Res 2008;14:2775–84 2. Collins SM et al. Cancer Immunol Immunother 2013;62:1841–9 3. Guo H et al. Mol Cell Biol 2015;35:41–51

Elotuzumab: Mechanism of Action

Immuno oncology agents

CD38 enzymatic inhibition Decreased immunosuppression Immunomodulation

Adenosine

cADPR ADPR NAADP

Ca2+ NAD

CD8+ T cell

CD38

MM cell

CD38 DARA

NK cell Macrophage Complement

CD38 MDSC

Immune-mediated activity Direct anti-tumor effect

ADPC ADCC CDC

MM cell

Adenosine AMP Ca2+ Ca2+ Ca2+ B reg

CD38+ T reg

DARA

Tumor cell death

DARA CD38

Apoptosis via cross-linking

  • 1. Lin P, et al. Am J Clin Pathol. 2004;121(4):482-488.
  • 2. Santonocito AM, et al. Leuk Res. 2004;28(5):469-477.
  • 3. de Weers M, et al. J Immunol. 2011;186(3):1840-1848.
  • 4. Overdijk MB, et al. MAbs. 2015;7(2):311-321.
  • 5. Krejcik J, et al. Presented at: 57th American Society of Hemato
Annual Meeting & Exposition; December 5-8, 2015; Orlando Abstract 3037.

Darartumumab: Mechanism of Action

slide-30
SLIDE 30

ELOQUENT-2: Elo-Len-Dex vs Len-Dex in Relapsed/Refractory MM

Progression-free survival Overall response rate

Months Lonial S, et al. ASCO. 2015; abstract 8508.

Elotuzumab 10 mg/kg IV d 1,8,15,22 (cycle 1,2); d 1,15 (cycles 3+) Lenalidomide 25 mg orally d 1-21 Dexamethasone 40 mg d 1,8,15,22 in 28-day cycles

0.0 0.1 0.2 0.3 0.4 0.5 0.6 0.7 0.8 0.9 1.0 38 0 2 4 6 8 10 12 14 16 18 20 22 24 26 28 30 32 34 36

57% 68% 27% 41%

Probability progression free

Median PFS Elo-Len-Dex 19.4 mos Len-Dex 14.9 mos 20 40 60 80 100

Response rate (%)

E-Ld Ld

ORR sCR + CR VGPR sCR + CR + VGPR PR MR

79 66 P=0.0002

Elo, elotuzumab; Len, lenalidomide; Dex, dexamethasone; ORR, overall response rate; CR, complete response; sCR, stringent complete response; VGPR, very good partial response; PR, partial response; MR, minimal response; PFS, progression-free survival.

slide-31
SLIDE 31

Response Rate

N = 32 n (%) 95% CI Overall response rate (sCR+CR+VGPR+PR) 26 (81) 63.6-92.8 Best response sCR CR VGPR PR 8 (25) 3 (9) 9 (28) 6 (19) 11.5-43.4 2.0-25.0 13.7-46.7 7.2-36.4 VGPR or better (sCR+CR+VGPR) 20 (63) 43.7-78.9 CR or better (sCR+CR) 11 (34) 18.6-53.2

19% 28% 9% 25%

10 20 30 40 50 60 70 80 90 100 16 mg/kg ORR, % sCR CR VGPR PR

ORR = 81%

34% CR/sCR

63% VGPR or better

  • ORR = 81%
  • Clinical benefit rate (ORR + minimal response) = 88%

N = 32

Daratumumab Lenaldomide Dexamethasone in RRMM

slide-32
SLIDE 32

PANORAMA: Pan-Bor-Dex in Relapsed MM

Panobinostat 20 mg orally d 1,3,5,8,12 in 21-day cycles Bortezomib 1.3mg/m2 Dexamethasone 20 mg

PAN-Bor-Dex Pbo-Bor-Dex

Progression-free survival Overall survival

100 80 60 40 20 4 8 12 16 20 24 28 32 36

Median PFS Pan-Bor-Dex 12.0 mos Pbo-Bor-Dex 8.1 mos

HR 0.63 P <0.0001

Median OS Pan-Bor-Dex 33.64 mos Pbo-Bor-Dex 30.39 mos PAN-Bor-Dex Pbo-Bor-Dex

HR 0.87 P =0.259

Months Months

Pan, panobinostat; Bor, bortezomib; Dex, dexamethasone; Pbo, placebo; PFS, progression-free survival; OS, overall survival

San-Miguel JF, et al. Blood. 2014;124: Abstract 4742.

slide-33
SLIDE 33

Young Fit Elderly Frail Elderly Diagnosis VRD/VCD – ASCT VRD/VCD Rd PI based Therapy Carf-Rd Carf-Rd Ixa-Rd MoAb Therapy Dara-R/Vd Dara-R/Vd Elo-R/Id LenPom Therapy Pom-Vd Pom-Vd Pom-Id HDAC Therapy Panob-Vd Panob-Vd Panob-Vd

ASCT, autologous stem cell transplant; BTZ, bortezomib; CARF, carfilzomib; CY, cyclophosphamide; D, dexamathasone; R, lenalidomide; V, bortezomib; MPV, melphalan+prednisone+thalidomide; POM, pomalidomide; Rd, lenalidomide +dexamethasone; VTD, bortezomib+thalidomide+dexamethasone; Panob, panobinostat.

Future Therapeutic Algorithm

slide-34
SLIDE 34

Conclusion

  • NDMM: Early intervention, CR rate, continuous therapy

– Young patients  ASCT – Elderly fit patients  three drug combo – Elderly frail patients  two drug combo

  • RRMM: Previous drug sensitivity, co-morbidities

– Fit: three drug regimen – Frail: two drug regimen

  • New comers
  • Carfilzomib, Ixazomib
  • Daratunumab, Elotuzumab,
  • Panobinostat,