
SLIDE 1
Overview of Comprehensive Pole-to-Pole Airborne Survey of Greenhouse Gases
James W. Elkins1, Steven C. Wofsy2, Fred L. Moore1,3, Eric J. Hintsa1,3, Ben R. Miller1,3, Stephen A. Montzka,
- J. David Nance1,3, Dale F. Hurst1,3, Colm Sweeney1,3, Elliot Atlas4,
David W. Fahey1, and the HIPPO team5
1NOAA Earth System Research Laboratory 2Harvard University 3Cooperative Institute for Research in Environmental Sciences 4Rosenstiel School of Marine and Atmospheric Sciences 5National Science Foundation
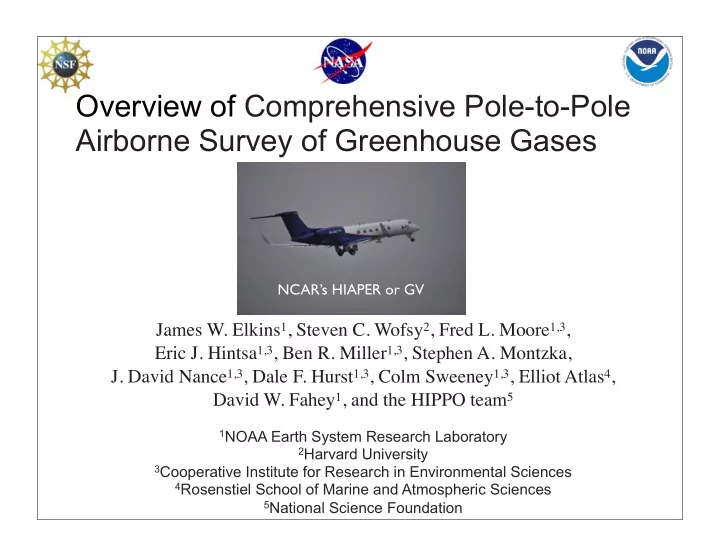
NCAR’s HIAPER or GV