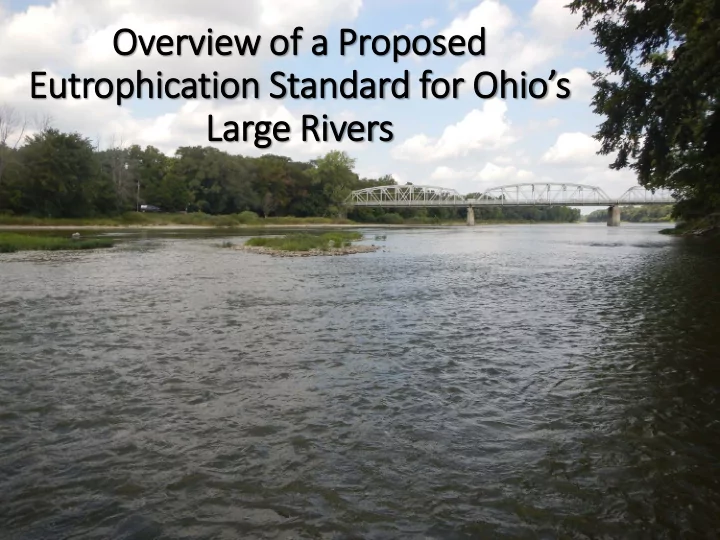

Ov Over ervi view o of a Prop opos osed ed Eutrophication S n Standar ard f for Ohio’s Large R Rivers
Eutrophication in Visual Context 165 μ g/l GMR when chlorophyll > 100 ug/l GMR when chlorophyll < 50 ug/l
Ohio Chlorophyll Levels in Context Ohio 25 th 50 th 75 th max (all data) 13 34 69 337 Thames Basin 25 th 50 th 75 th max Maximums * 15 42 85 328 25 th 50 th 75 th Van Nieuwenhuyse max & Jones 1996 (all data) 4.9 17 35 170 Oligotrophic Mesotrophic Eutrophic Sestonic Chlorophyll ug/l a 21 sampling stations sampled weekly over three years
Daily Water Column Chlorophyll in the GMR USGS Data From 8/25/1999 to 4/15/2001 Near Bolton Well Field 150 100 CHL ug/l 50 Sep 99 Aug 00 Apr 01 0 36400 36500 36600 36700 36800 36900 37000
Daily Oxygen Range and Chlorophyll USGS Well Field Study 15 24 h D.O. Range 10 5 0 10 20 50 100 Sestonic Chlorophyll ug/l
5-day Biological Oxygen Demand and Chlorophyll 20 5-day BOD mg/l 15 10 pre-construction grant levels elevated levels 5 0 2 5 10 20 50 100 200 Sestonic Chlorophyll ug/l
Biological Indicators and Eutrophication 55 55 50 50 Fish IBI Fish IBI Rivers w/o legacy problems 45 45 Rivers with legacy problems 40 40 35 35 30 30 3.5 4.0 4.5 5.0 3.8 4.2 4.6 5.0 Log10 Chla Log10 TSS 50 40 Sensitives 40 30 EPT 30 20 20 10 10 0 3.0 3.2 3.4 3.6 3.8 4.0 5 10 15 Log10 BOD5 24 h D.O. Range
Eutrophication S tandard - Box Model Acceptable Enriched or Over Enriched Over Enriched Indicator Chronic Condition Acute Condition Sestonic <30 ug/l as Magnitude Magnitude Chlorophyll seasonal 30 < 100 ug/l seasonal average > 100 ug/l anytime with biological average with biological impairment; impairment; Frequency Frequency > 30 < 100 ug/l as seasonal > 100 ug/l multiple observations at average in two of three years base flow BOD5 <2.5 mg/l as Magnitude Magnitude seasonal > 2.5 < 6 mg/l seasonal > 6 mg/l anytime with biological average average with biological impairment and seasonal average impairment chlorophyll > 30 ug/l Frequency Frequency > 2.5 < 6 mg/l as seasonal > 6 mg/l two or more times during average in two of three years the base flow period 24-Hour <6.5 mg/l >7 mg/l – 9.0 mg/l (default to Magnitude and Frequency D.O. Range chlorophyll, BOD5 and ≥9.0 mg/l anytime with biological biological indicators) impairment TKN NA NA ≥0.75 mg/l May substitute for BOD5 TSS ~20 mg/l; general screening level for inspection of data sets lacking chlorophyll observations.
Phosphorus Target 3.0 2.5 Log10 Chlorophyll ug/l 2.0 1.5 1.0 0.5 0.0 0 1 2 3 4 Log10 TP ug/l
TSS, Flow and Chlorophyll GMR at Miamisburg; July 2010 275.0 6000 6000 Flow TSS 4000 4000 110.190 3000 3000 Flow CFS Flow CFS TSS 2000 2000 54.131 34.608 1000 1000 22.158 40360 40360 40365 40365 40370 40370 40375 40375 40380 40380 40385 40385 40390 40390 jDate jDate
Flow, TSS and Chlorophyll 500 Log10 TSS 100 TSS mg/l 5.5 20 4.5 5 3.5 1 500 2000 5000 20000 5.0 5.5 6.0 6.5 7.0 7.5 Flow CFS Log10 Iron Chlorophyll ug/l 200 500 TSS mg/l 50 100 10 20 5 5 2 2 2 5 10 20 50 200 Under Over TSS|Fe Chlorophyll ug/l
Distributions of Water Quality Parameters Binned by Whether TSS is Under or Over Predicted 50 2.0 BOD5 mg/l TKN mg/l 20 1.0 10 0.5 5 2 0.2 1 Under Over Under Over TSS|Fe TSS|Fe 5.0 2.00 NOx mg/l 2.0 TP mg/l 0.50 1.0 0.20 0.5 0.05 0.2 Under Over Under Over TSS|Fe TSS|Fe
Phosphorus Target 52 759 357 52 759 357 500 5.00 500 NOx ug/l TP ug/l 1.00 100 0.20 20 0.05 5 <5 5-32 >32 <5 5-32 >32 N:P N:P 12 115 12 350 52 759 357 TSS as Chlorophyl 1.0 Chlorophyll ug/l 0.5 250 -0.5 0.0 150 50 -1.5 0 <5 5-32 >32 <5 5-32 >32 N:P N:P
S ummary of Findings and Considerations • Evidence of over-enrichment is compelling • Eutrophication benchmarks are defensible • amenable to a box model • TP target ~ 130 ug/l • seasonal average; summer base-flow conditions
Going Forward Immediate & Near-Term 1. Peer-review publication 2. Share technical document and begin dialogue with EPA Medium-Term 3. Start ESO 4. Add aspects of implementation to technical document Long-Term 5. Conclude ESO 6. Produce rule package
Recommend
More recommend