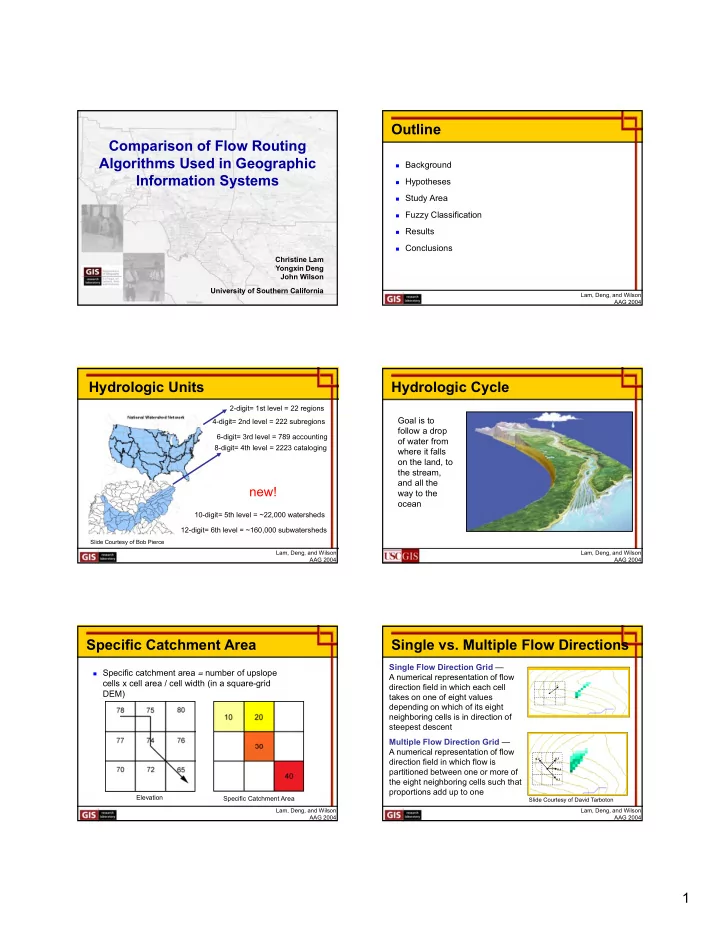
outline comparison of flow routing algorithms used in
play

Outline Comparison of Flow Routing Algorithms Used in Geographic - PDF document

Outline Comparison of Flow Routing Algorithms Used in Geographic Background Information Systems Hypotheses Study Area Fuzzy Classification Results Conclusions Christine Lam Yongxin Deng John Wilson University of


  1. Outline Comparison of Flow Routing Algorithms Used in Geographic  Background Information Systems  Hypotheses  Study Area  Fuzzy Classification  Results  Conclusions Christine Lam Yongxin Deng John Wilson University of Southern California Lam, Deng, and Wilson AAG 2004 Hydrologic Units Hydrologic Cycle 2-digit= 1st level = 22 regions Goal is to 4-digit= 2nd level = 222 subregions follow a drop 6-digit= 3rd level = 789 accounting of water from 8-digit= 4th level = 2223 cataloging where it falls on the land, to the stream, and all the new! way to the ocean 10-digit= 5th level = ~22,000 watersheds 12-digit= 6th level = ~160,000 subwatersheds Slide Courtesy of Bob Pierce Lam, Deng, and Wilson Lam, Deng, and Wilson AAG 2004 AAG 2004 Specific Catchment Area Single vs. Multiple Flow Directions Single Flow Direction Grid —  Specific catchment area = number of upslope A numerical representation of flow cells x cell area / cell width (in a square-grid direction field in which each cell 1 DEM) takes on one of eight values depending on which of its eight neighboring cells is in direction of steepest descent Multiple Flow Direction Grid — A numerical representation of flow direction field in which flow is 0.2 0.3 partitioned between one or more of 0.4 the eight neighboring cells such that 0.1 proportions add up to one Elevation Specific Catchment Area Slide Courtesy of David Tarboton Lam, Deng, and Wilson Lam, Deng, and Wilson AAG 2004 AAG 2004 1

  2. Flow Directions Flow Routing Algorithms  D8 (O’Callaghan and Mark 1981)  Rho8 (Fairfield and Leymarie 1991)  FD8 (Quinn et al. 1991) Some other flow routing algorithms  DEMON (Lea 1992, Costa-Cabral and Burges 1994) calculate flow directions in 1º increments  D∞ (Tarboton 1997) FD8 – 45º increments Lam, Deng, and Wilson Lam, Deng, and Wilson AAG 2004 AAG 2004 Null Hypotheses Study Area Metrics  The performance of five popular flow routing  Point Dume, CA 1:24K algorithms in computing specific catchment area USGS map quadrangle does not change as flow descends from higher to  1.3 million grid points lower elevations with 10 m spacing  The performance of the five flow routing  Elevations range from 0 algorithms does not vary across different m (sea level) to 859.7 m landscape classes produced with fuzzy k -means algorithm of Burrough and McDonnell (1998)  Much of region is parkland or some other type of protected open space Lam, Deng, and Wilson Lam, Deng, and Wilson AAG 2004 AAG 2004 Fuzzy Classification Fuzzy Classification  Used PCRaster to calculate 8 topographic attributes  Elevation  Distance to Ridgelines  Slope  Solar Insolation  Profile Curvature  Topographic Wetness Index  Plan Curvature  Sediment Transport Capacity Index  Used FUZNLM fuzzy k -means classifier to identify 6 A landform classes  Assigns membership values to grid cells  Assigns classes based on largest membership values B Lam, Deng, and Wilson Lam, Deng, and Wilson AAG 2004 AAG 2004 2

  3. Hilltops / Ridgelines North-facing Slopes  High elevations  High elevations  Ridgelines are nearby  Very steep slopes  Low topographic wetness index  Low solar insolation  High solar radiation INSET A INSET A INSET B INSET B Lam, Deng, and Wilson Lam, Deng, and Wilson AAG 2004 AAG 2004 South-facing Slopes Footslopes / Lower Valley Slopes  Low elevations  High elevations  Moderately steep slopes  Very steep slopes  Ridgelines are far away  High solar insolation  High topographic wetness index INSET A INSET A INSET B INSET B Lam, Deng, and Wilson Lam, Deng, and Wilson AAG 2004 AAG 2004 Stream Channels Coastal Plain / Gentle Slopes  Long distances to ridgelines  Low elevations  High topographic wetness index  Gentle slopes  High sediment transport capacity  High topographic wetness index index INSET A INSET A INSET B INSET B Lam, Deng, and Wilson Lam, Deng, and Wilson AAG 2004 AAG 2004 3

  4. Crisp Landscape Classes Hypothesis #1 Number of cells Minimum Maximum Mean SCA (m 2 m -1 ) Standard Deviation (m 2 m -1 ) D8 1,263,296 7.07 2237670.25 3715.27 60584.28 Rho8 1,263,296 7.07 2236030.25 3714.18 60469.64 D∞ 1,263,296 10.00 2236762.00 3934.18 61469.07 FD8 1,263,296 2.56 2341777.00 4355.83 69911.69 DEMON 1,263,296 7.07 2214353.00 3428.91 55657.18 SCA (m 2 m -1 ) ≤ 10.0 10.1 – 20 20.1 - 40 40.1 - 70 70.1 - 100 100.1 – 1000 > 1000 D8 12.8 18.5 26.9 16.3 7.2 13.3 5.1 Rho8 13.4 21.6 25.0 14.3 6.7 14.0 5.1 D∞ 7.6 12.9 29.9 20.1 7.9 16.0 5.7 INSET A INSET B FD8 4.5 12.1 24.5 20.7 10.0 23.2 5.2 DEMON 2.7 12.2 29.3 23.6 9.6 17.6 5.0 Lam, Deng, and Wilson Lam, Deng, and Wilson AAG 2004 AAG 2004 Source Cells (SCA ≤ 10 m 2 m -1 ) Stream Cells (SCA ≥ 5,300 m 2 m -1 ) D8 Rho8 D ∞ USGS DLG D8 Rho8 FD8 DEMON D ∞ FD8 DEMON Lam, Deng, and Wilson Lam, Deng, and Wilson AAG 2004 AAG 2004 Hypothesis #2 Matched Pairs T-test Class 6 – Ridgelines  Chose every 1000 th cell and calculated differences D8 Rho8 D∞ FD8 DEMON between pairs of cell values D8 -- Used critical t-test values of ±1.96 (5%) and ±2.58 Rho8 -3.55 -- (1% level of significance) D∞ -10.97 1.38 --  Used matched paired t-test to test whether differences FD8 -5.94 -3.67 -3.44 -- were significantly different than 0 DEMON -10.93 -5.22 -6.81 1.16 -- Class 4 - North-facing slopes  Compared t-test results by landscape class and flow D8 Rho8 D∞ FD8 DEMON routing algorithm D8 -- -- -- -- -- Rho8 -1.04 -- -- -- -- D∞ -2.20 -1.42 -- -- -- FD8 4.00 -3.33 -1.98 -- -- DEMON -3.78 -1.09 0.76 3.08 -- Lam, Deng, and Wilson Lam, Deng, and Wilson AAG 2004 AAG 2004 4

  5. Matched Pairs T-test Matched Pairs T-test Class 5 – South-facing slopes Class 2 – Moderately steep lower valley slopes D8 Rho8 D∞ FD8 DEMON D8 Rho8 D∞ FD8 DEMON D8 -- -- -- -- -- D8 -- -- -- -- -- Rho8 -0.94 -- -- -- -- Rho8 1.78 -- -- -- -- D∞ -2.24 0.40 -- -- -- D∞ 0.85 -1.96 -- -- -- FD8 -5.12 -0.45 -2.37 -- -- FD8 -0.38 -2.26 -1.16 -- -- DEMON -3.46 0.50 0.71 3.91 -- DEMON -0.55 -2.16 -1.19 0.16 -- High elevation summary Class 3 - Stream channels D8 Rho8 D∞ FD8 DEMON D8 Rho8 D∞ FD8 DEMON D8 -- D8 - Rho8 1.02 -- Rho8 1 - D∞ 3 0 - D∞ -0.94 -1.15 -- FD8 3 2 3 - FD8 -1.82 -1.44 0.82 -- DEMON 3 1 1 2 - DEMON 2.40 0.08 1.17 2.71 -- Lam, Deng, and Wilson Lam, Deng, and Wilson AAG 2004 AAG 2004 Matched Pairs T-test T-test Summary Class 1 - Coastal plain / gentle slopes  Number of landscape classes for which null D8 Rho8 D∞ FD8 DEMON D8 -- -- -- -- -- hypotheses was rejected Rho8 -1.61 -- -- -- -- D∞ 0.98 0.99 -- -- -- FD8 -1.13 -1.05 -1.00 -- -- D8 Rho8 D∞ FD8 DEMON DEMON -0.19 1.01 -0.98 1.01 -- D8 - Low elevation summary Rho8 1 - D8 Rho8 D∞ FD8 DEMON D∞ 3 0 - D8 - FD8 3 3 3 - Rho8 0 - DEMON 4 2 1 3 - D∞ 0 0 - FD8 0 1 0 - DEMON 1 1 0 1 - Lam, Deng, and Wilson Lam, Deng, and Wilson AAG 2004 AAG 2004 Distribution of Source Cells Distribution of Stream Cells Number of Cells with SCA ≤ 10 m 2 m -1 Number of Cells with SCA ≥ 5,300 m 2 m -1 Number Number Landscape Class of Cells D8 Rho8 D∞ FD8 DEMON Landscape Class of Cells D8 Rho8 D∞ FD8 DEMON Hilltops / ridgelines 256,012 114,186 79,789 64,966 39,215 23,583 Hilltops / ridgelines 256,012 0 13 15 0 1 Steep south-facing Steep south-facing slopes 323,989 1,686 25,568 481 107 91 slopes 323,989 8 158 133 11 5 Steep north-facing Steep north-facing slopes 231,180 5,630 18,584 331 72 86 slopes 231,180 5 137 159 6 6 Moderately steep Moderately steep lower valley slopes 169,173 37 8,245 175 15 9 lower valley slopes 169,173 949 1,439 1,669 1,013 810 Coastal plains / Coastal plains / gentle slopes 177,787 39,893 36,526 28,995 16,709 9,960 gentle slopes 177,787 801 1,221 1,494 884 793 Stream channels 103,888 35 459 94 62 27 Stream channels 103,888 26,866 25,744 27,853 27,896 25,678 Total Area 1,262,029 161,467 169,171 95,042 56,180 33,756 Total Area 1,262,029 28,685 28,766 31,340 29,885 27,316 Lam, Deng, and Wilson Lam, Deng, and Wilson AAG 2004 AAG 2004 5

  6. Conclusions  Flow routing results vary systematically from top to bottom of catchments  Previous studies have demonstrated that different groups of algorithms perform in similar ways D8 and Rho8  D∞ and DEMON  FD8   This outcome is partially repudiated by my results – Rho8 and D∞ are most similar and FD8 is most unique  D8 and Rho8 have many undesirable properties and should be avoided as often as possible Lam, Deng, and Wilson AAG 2004 6

Download Presentation
Download Policy: The content available on the website is offered to you 'AS IS' for your personal information and use only. It cannot be commercialized, licensed, or distributed on other websites without prior consent from the author. To download a presentation, simply click this link. If you encounter any difficulties during the download process, it's possible that the publisher has removed the file from their server.

Recommend


More recommend