
SLIDE 1
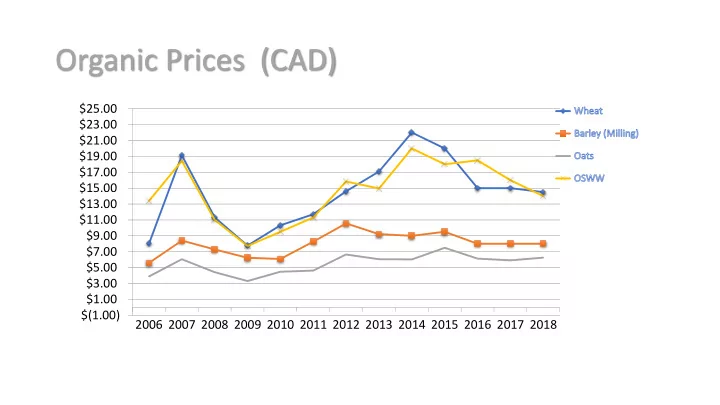
Organic Prices (CAD)
$(1.00) $1.00 $3.00 $5.00 $7.00 $9.00 $11.00 $13.00 $15.00 $17.00 $19.00 $21.00 $23.00 $25.00 2006 2007 2008 2009 2010 2011 2012 2013 2014 2015 2016 2017 2018
Organic Prices (CAD) $25.00 $23.00 $21.00 $19.00 $17.00 $15.00 - - PowerPoint PPT Presentation
Organic Prices (CAD) $25.00 $23.00 $21.00 $19.00 $17.00 $15.00 $13.00 $11.00 $9.00 $7.00 $5.00 $3.00 $1.00 $(1.00) 2006 2007 2008 2009 2010 2011 2012 2013 2014 2015 2016 2017 2018 Conventional Vs. Organic Chart Title Wheat Barley
$(1.00) $1.00 $3.00 $5.00 $7.00 $9.00 $11.00 $13.00 $15.00 $17.00 $19.00 $21.00 $23.00 $25.00 2006 2007 2008 2009 2010 2011 2012 2013 2014 2015 2016 2017 2018
0% 50% 100% 150% 200% 250% 300% 350% 400% 450% 2006 2007 2008 2009 2010 2011 2012 2013 2014 2015 2016 2017 2018
Chart Title
Wheat Barley Oats Corn PROPRIETARY & CONFIDENTIAL 2
When Imports Make sense
$- $2.00 $4.00 $6.00 $8.00 $10.00 $12.00 $14.00 $16.00 $18.00 $20.00
Prices USD/Short Ton
CAD / BU
$- $2.00 $4.00 $6.00 $8.00 $10.00 $12.00 $14.00 $16.00 $18.00 $20.00
Prices USD/Short Ton
CAD / BU Del Saskatoon
Data Credited to COTA CONFIDENTIAL 5 500 1000 1500 2000 2014 2015 2016 2017 2018 (Sam's est)
Crop Producers
Crop Producers 500 1000 1500 2000 2500 2014 2015 2016 2017 2018 (Sam's Est)
Acres (Thousands)
Acres (Thousands) 29% Growth 25% Growth
CONFIDENTIAL
5 10 15 20 25 2009 2010 2011 2012 2013 2014 2015 2016 2017
Growth Percentage
Growth Percentage
positions position (US Oats and Corn) and likely to grow from there.
major concerns out there for our organic crop right now unless we continue to see dry weather patterns. (which could happen).