
SLIDE 1
- ligoExpress – exploiting probe level
information in Affymetrix GeneChip expression data
Jan Budczies
PROVITRO GmbH, Berlin and Institute of Pathology, Charité Hospital, Berlin E-Mail: jb@provitro.de useR! – The R User Conference 2006
PROVITRO - cells and more
Three ways to analyse GeneChip data
- Absolute analysis (1 chip):
Signals, detection p-values, detection calls
- Comparison analysis (1 chip vs 1 chip):
SLRs, change p-values, change calls
- Group analysis (m chips vs n chips):
Statistics on absolute and comparison analysis results e.g.: t-test on signals, t-test on SLRs, percent of increase or decrease calls
Toy data: 6 hybridizations from the Affymetrix Latin Square Experiment (HG-U133A)
- Comparison of EXP1 (3 replicates) versus EXP2
(3 replicates)
- 30 spikes were mixed into the background RNA at
14 concentrations (0, 0.125, 0.25, …, 512 pmol)
- Concentrations of spikes differ between EXP1 and
EXP2 (fold change = 2)
- SLRs and change calls were calculated between
each pair of chips from EXP1 and EXP2 (9 comparisons)
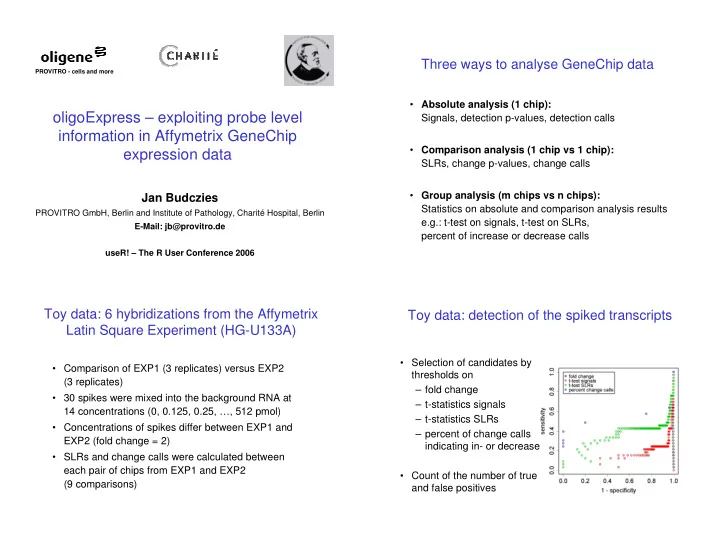
Toy data: detection of the spiked transcripts
- Selection of candidates by
thresholds on – fold change – t-statistics signals – t-statistics SLRs – percent of change calls indicating in- or decrease
- Count of the number of true