
SLIDE 1
Alaska Department
- f Revenue
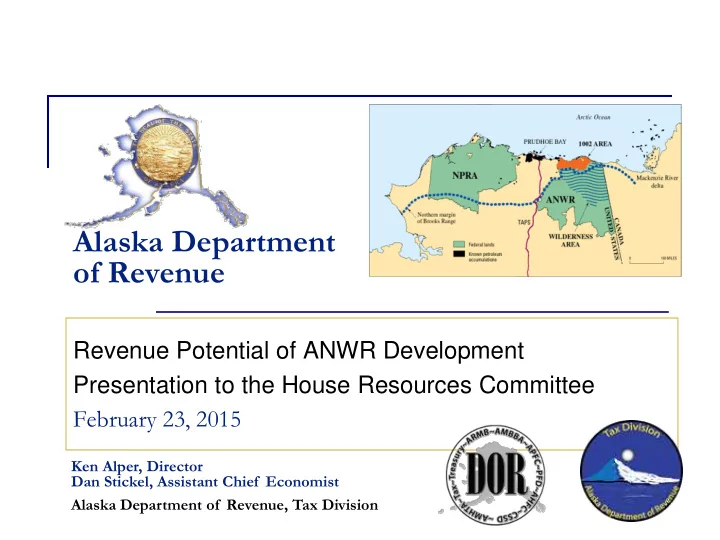
Revenue Potential of ANWR Development Presentation to the House Resources Committee February 23, 2015
Ken Alper, Director Dan Stickel, Assistant Chief Economist Alaska Department of Revenue, Tax Division