SLIDE 51 Gilliland, J. 2010. The built environment and obesity: trimming waistlines through neighbourhood design, pp. 391-410, In: Bunting, T., Filion, P. and Walker, R. (editors) Canadian Cities in Transition: New Directions in the Twenty -first
- Century. Don Mills: Oxford University Press Canada, 468 pp.
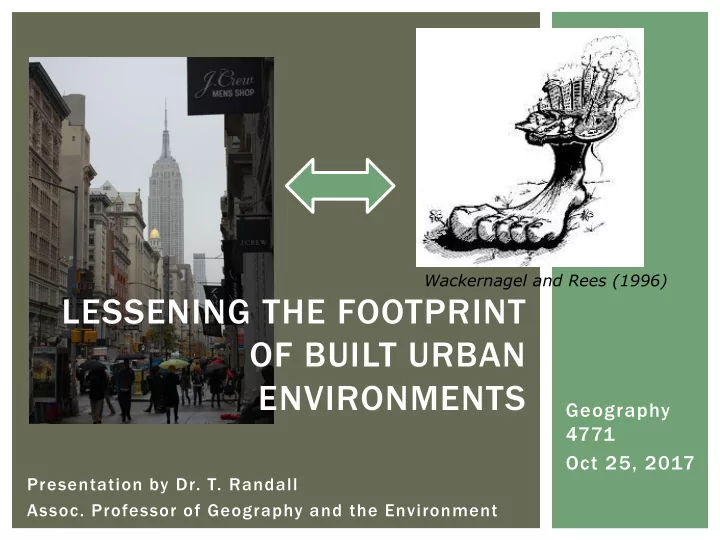
Jacobs, J. 1961. The Death and Life of Great American Cities, New York: Random House, 458 pp. Newman, P. and Kenworthy, J. 1999. Overcoming Automobile Dependence, Island Press, 450 pp. Owen, D., 2009. Green Metropolis: Why Living Smaller, Living Closer, and Driving Less Are the Keys to Sustainability. New York, NY: Riverhead Books Randall, T.A. and Baetz, B.W. 2015. A GIS-based land use diversity index model to measure the degree of suburban sprawl. Area 47 (4): 360-375. Smith, C.J. and Randall, T.A. 2008. Measuring residential lot and neighbourhood changes in Hamilton, Ontario. Canadian Journal of Urban Research, 17 (1): 155-164. The World Commission on Environment and Development (WCED ) 1987. Our Common Future. New York: Oxford University Press. Wackernagel, M. and Rees, W. 1996. Our Ecological Footprint: Reducing Human Impact on the Earth, Gabriola Island, BC: New Society Publishers, 160 pp.
SELECTED REFERENCES**