
SLIDE 1
Observations, Ray-Tracing, and Data Assim ilation in Aerosol Assessm ent
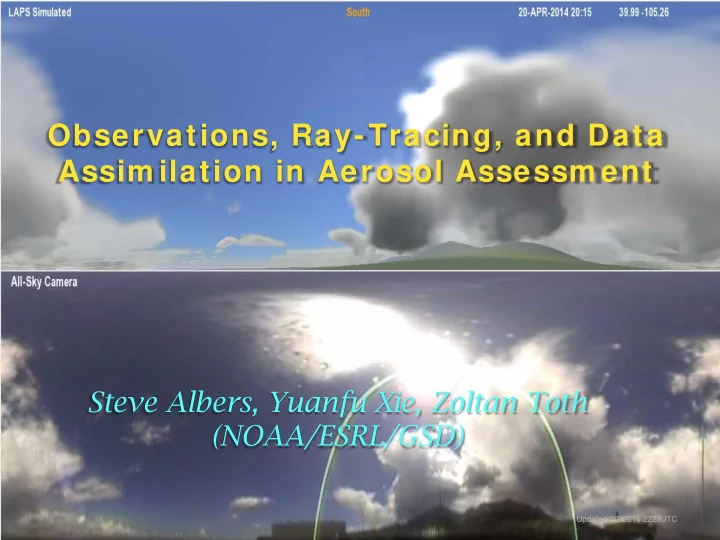
Steve Albers, Yuanfu Xie, Zoltan Toth (NOAA/ESRL/GSD)
Updated 2/2/2016 2223UTC
Observations, Ray-Tracing, and Data Assim ilation in Aerosol Assessm - - PowerPoint PPT Presentation
Observations, Ray-Tracing, and Data Assim ilation in Aerosol Assessm ent Steve Albers, Yuanfu Xie, Zoltan Toth (NOAA/ESRL/GSD) Updated 2/2/2016 2223UTC Model Simulated All-Sky Image (left) Compared with All-Sky Camera (right) A way to peer
Updated 2/2/2016 2223UTC
24
3
4
METAR METAR METAR
5
First Guess 11um,VIS,3.9um (Albers et. al. 1996)
6
(Meyer-Womble Observatory
Acknowledgement to Kirk Holub (GSD) as camera engineer
7
Daytime clouds Nighttime clouds Rainbow Sunset colors SIMULATED OBSERVED SIMULATED OBSERVED
Renewable Energy Link
Aerosols modeled with vertical extinction coefficient profile and scattering phase
distribution
Boulder area
SIMULATED SIMULATED OBSERVED OBSERVED
SIMULATED OBSERVED
Earth curvature and aerosol scale height
experimental at ESRL/CSD
Twilight / Airglow 790km up
+ City Lights, Zodiacal Light, Galactic Glow
Martian Sky –
Mainly Dust
Earth global view
Compare with DSCOVR / Himawari
Lunar Eclipse
Sensitive to stratospheric aerosols, ozone, clouds
More at laps.noaa.gov/allsky/allsky.cgi OR steve.albers@noaa.gov
“Launch” into the stratosphere (40km up), 360o spherical view
(1/4 degree resolution)
radiances
More at laps.noaa.gov/allsky/allsky.cgi