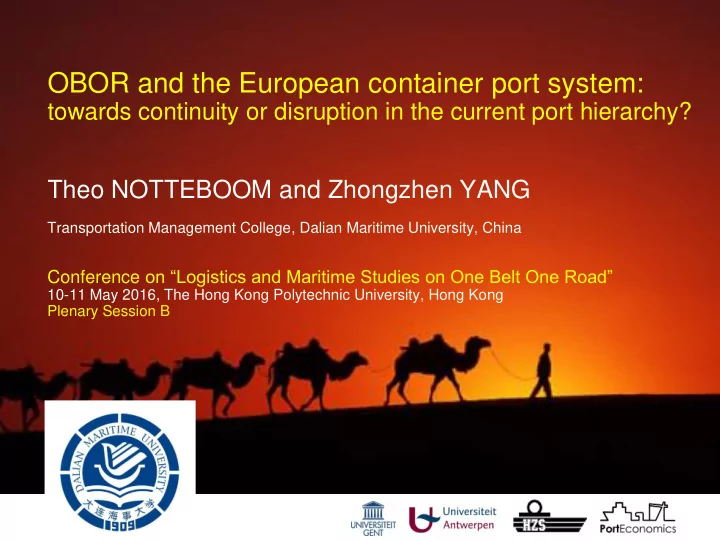
obor and the european container port system
play

OBOR and the European container port system: towards continuity or - PowerPoint PPT Presentation

OBOR and the European container port system: towards continuity or disruption in the current port hierarchy? Theo NOTTEBOOM and Zhongzhen YANG Transportation Management College, Dalian Maritime University, China Conference on Logistics and


  1. OBOR and the European container port system: towards continuity or disruption in the current port hierarchy? Theo NOTTEBOOM and Zhongzhen YANG Transportation Management College, Dalian Maritime University, China Conference on “Logistics and Maritime Studies on One Belt One Road” 10-11 May 2016, The Hong Kong Polytechnic University, Hong Kong Plenary Session B

  2. Notteboom & Yang HK, 9-11 May 2016 Contents 1. Recent developments in the European port system 2. Current situation OBOR: considerations for EU ports 3. Possible impact on port hierarchy in Europe

  3. Year-on-year growth in total EU28 port traffic (basis = ton) and EU GDP Notteboom & Yang HK, 9-11 May 2016 Traffic peaked in 2008: 2015: 3.69 billion tons 3.83 billion tons 6% Percentage growth compared to the prrevious year 4% 2% 0% -2% -4% Total throughput -6% GDP growth EU27/EU28 -8% -10% -12% -14% 2006 2007 2008 2009 2010 2011 2012 2013 2014 2015 Source: Notteboom (2016)

  4. Notteboom & Yang HK, 9-11 May 2016 Source: Eurostat

  5. Are we back at pre-crisis traffic levels? Index evolution of throughput in the EU port system (2008=100) Notteboom & Yang HK, 9-11 May 2016 Total throughput is still about 4.6% below the 2008 level 125 120 115 Index evolution - 2008 = 100 110 105 Containers 100 Liquid bulk 95 Dry bulk 90 Conventional general cargo 85 Roro traffic 80 Total 75 70 65 2005 2006 2007 2008 2009 2010 2011 2012 2013 2014 2015 Liquid bulk saw a minor Container volumes Dry bulk: drop in 2009, but managed to get well above no recovery records further traffic the 2008 level decline after 2009 Source: Notteboom (2016)

  6. Regional shares in total TEU of Other Scandinavia Baltic the European container port system UK / Ireland Notteboom & Yang HK, 9-11 May 2016 Hamburg-Le Havre range Atlantic range Black Sea Mediterranean 60% 55% 50% Share in total container throughput Hamburg-Le Havre range 45% Mediterranean range 40% UK range Atlantic range 35% Baltic 30% Black Sea 25% 20% 15% 10% 5% 0% 1985 1986 1987 1988 1989 1990 1991 1992 1993 1994 1995 1996 1997 1998 1999 2000 2001 2002 2003 2004 2005 2006 2007 2008 2009 2010 2011 2012 2013 2014 2015 Source: Notteboom (2016)

  7. Transhipment incidence in ranges of Other Scandinavia Baltic European port system UK / Ireland Notteboom & Yang HK, 9-11 May 2016 Hamburg-Le Havre range Atlantic range Black Sea Mediterranean TOTAL EU Black Sea (EU) 2004 Baltic 2008 UK 2012 Mediterranean range (EU) Atlantic range Hamburg-Le Havre range 0% 10% 20% 30% 40% 50% 60% 70% Transhipment incidence (%) Source: Notteboom (2014)

  8. Multi-port gateway regions (% in European TEU traffic) Gateway port 2008 2012 2014 2015 1. Rhine-Scheldt Delta 24.7% 24.1% 23.4% 23.8% Transhipment/interlining port 2. North Germany 16.8% 15.8% 15.4% 14.8% (transhipment incidence >75%) 3. Seine Estuary 2.9% 2.6% 2.6% 2.6% 4. Portugese Range 1.4% 1.8% 2.4% 2.4% Gateway port also handling 5. Spanish Med range 6.9% 6.7% 6.4% 6.6% substantial transhipment flows 6. Ligurian Range 4.5% 4.1% 4.1% 4.4% 7. North Adriatic 1.6% 1.9% 2.0% 2.2% 8. UK Southeast Coast 7.4% 6.4% 6.8% 7.6% Finland Multi-port gateway region 9. Gdansk Bay 0.9% 1.7% 2.0% 1.8% 10. Black Sea West 1.7% 0.9% 0.8% 0.9% (N) 11 Sweden (M) 11. South Finland 1.6% 1.4% 1.2% 1.2% Main stand-alone gateways Rauma (O) Norway St-Petersburg 12. Kattegat/The Sound 1.9% 1.7% 1.6% 1.6% Turku ALL 12 multi-port gateway regions 72.1% 69.0% 68.8% 70.0% Bergen Oslo Stockholm Tallinn Main shipping route Stand-alone gateways 16.6% 20.2% 20.1% 19.2% Estonia West Med hubs 11.3% 10.7% 11.1% 10.8% Source: Notteboom (2010; 2016) Göteborg 12 Latvia Ventspils Riga Grangemouth Russia Aarhus Lithuania Helsingborg Belfast UK Malmö Klaipeda Teesport Den. Ireland Copenhagen Dublin Hull Belarus Lübeck Gdynia Gdansk (P) Liverpool 1 Szczecin 9 (E) Hamburg Cork (L) (H) (K) NL Americas 2 (J) Poland (D) (A) (I) 8 Germany Ukraine (G) (B) (C) (F) Belg. Le Havre Czech Republic Slovakia Rouen Brest 3 France Nantes-St-Nazaire Austria Hungary Switz. Romania Americas Constantza Trieste Bordeaux Koper 10 Croatia (A) Antwerp Venice Rijeka (B) Zeebrugge Ravenna Santander Genoa Varna Ferrol Bosnia& Gijon Savona (C) Ghent Serbia Marseille-Fos La Spezia 7 Burga Herz. (D) Rotterdam Vigo s Bulgaria Bilbao Livorno (E) Amsterdam 6 Leixoes (F) Dunkirk 4 Mace. Italy Barcelona (G) Southampton Portugal Spain Turkey Thessaloniki Lisbon Alb. (H) Felixstowe Tarragona Setubal (I) Thamesport Naples Greece Valencia 5 Taranto (J) Tilbury Sines (K) London Gateway Cagliari Sevilla (L) Bremerhaven Piraeus Cadiz Malaga Cyprus Algeciras (M) Kotka Gioia Tauro Main shipping route (N) Hamina (O) Helsinki Middle East – Far East Algeria Tunisia (P) Wilhelmshaven Morocco Marsaxlokk Malta

  9. Gateway port Multi-port gateway regions 1. Rhine-Scheldt Delta Transhipment/interlining port (transhipment incidence >75%) 2. Helgoland Bay Gateway port also handling 3. UK SE Coast Notteboom & Yang substantial transhipment flows 4. Spanish Med HK, 9-11 May 2016 5. Ligurian Range Multi-port gateway region 6. Seine Estuary 8 7. Black Sea West Main shipping route 8. South Finland 9. Portugese Range 10. North Adriatic 11. Gdansk Bay 12 12. Kattegat/The Sound 11 2 Corridor-based competition among multi- 1 3 port gateway regions creates routing Americas flexibility for goods flows to/from inland West South Poland/ Germany Czech Republic/ economic centres Slovakia/Hungary 6 Bavaria Alpine region Americas Northern Italy 7 South 10 France 5 9 Madrid and surroundings 4 Main shipping route Middle East – Far East Source: Notteboom (2009)

  10. The intermodal challenge Notteboom & Yang HK, 9-11 May 2016 Hinterland coverage:  Advances in intermodal solutions for local/regional hinterland  (extended gates, etc..) Going beyond the ‘comfort zone’ remains difficult  Trunk lines to gateway ports: large scale co-modality is  concentrated More than half of total European container traffic by rail is  concentrated in 6 ports About 90% of European container traffic by barge is linked to  Antwerp and Rotterdam Overcoming the critical mass challenge by bundling cargo from multiple  ports in inland centres

  11. Notteboom & Yang HK, 9-11 May 2016 Contents 1. Recent developments in the European port system 2. Current situation OBOR: considerations for EU ports 3. Possible impact on port hierarchy in Europe

  12. One Belt, One Road (OBOR) Notteboom & Yang HK, 9-11 May 2016 Launched in September/October 2013 by Xi Jinping to “break the  connectivity bottleneck” in Asia Cultural/historical, geo-economic and geo-political motives  March 2015: ‘One Belt, One Road’ initiatives action plan.  Already 60 countries involved (impacting 4.4 billion people)  Bottomless funding possibilities?  Silk Road Fund: USD 40 bln  Asian Infrastructure Investment Bank (AIIB): registered capital of USD 100 bln (of which USD  50 bln from China) New Development Bank: USD 50 bln  CITIC-group: USD 113 bln support  Etc.. 

  13. Land-based Silk Road Economic Belt (one Belt) and 21st century Maritime Silk Road (one Road) Notteboom & Yang (source: Xinhua net) HK, 9-11 May 2016 13

  14. Notteboom & Yang HK, 9-11 May 2016 Source: Merics 14

  15. Notteboom & Yang HK, 9-11 May 2016

  16. Notteboom & Yang HK, 9-11 May 2016 List of 83 EU seaports in the Core Network Key port in CT investments by maritime silk road large Asian global terminal operators CT investments by Chinese interests PSA (Singapore) China Cosco HPH (Hong Kong) Shipping Group SIPG CMHI (via 49% in Terminal Link)

  17. The ambitions of Piraeus Notteboom & Yang HK, 9-11 May 2016 Fast grower in container business:  3.36 million TEU in 2015 compared to 880,000 TEU in 2010  2016: Cosco acquires majority stake in Piraeus port  280.5 million euro for the initial acquisition of a 51%  Another 88 million euro within five years for the remaining 16%, provided it has  implemented the agreed investments in the port. Connecting Piraeus via rail:  December 2014: by 2017, rail link between Budapest and Belgrade financed by Chinese companies, which will be connected to Macedonia and Piraeus 17

  18. The ambitions of Venice New Container Terminal and Offshore Terminal VOOPS: Venice Offshore Onshore Port System Notteboom & Yang HK, 9-11 May 2016 New CT Venice in 2015: 560,301 TEU (1.4 mln TEU – 1st phase) Lagoon Offshore facility 18

Download Presentation
Download Policy: The content available on the website is offered to you 'AS IS' for your personal information and use only. It cannot be commercialized, licensed, or distributed on other websites without prior consent from the author. To download a presentation, simply click this link. If you encounter any difficulties during the download process, it's possible that the publisher has removed the file from their server.

Recommend


More recommend