o ctober 2009 n iagara on the l ake i nadequacy of w ind
play

O CTOBER 2009 N IAGARA - ON - THE L AKE I NADEQUACY OF W IND T - PDF document

PRESENTATION TO THE A NNUAL C ONFERENCE OF THE C ANADIAN A COUSTICS A SSOCIATION O CTOBER 2009 N IAGARA - ON - THE L AKE I NADEQUACY OF W IND T URBINE N OISE R EGULATIONS AND THEIR A PPLICATION John P Harrison Physics Department, Queens


  1. PRESENTATION TO THE A NNUAL C ONFERENCE OF THE C ANADIAN A COUSTICS A SSOCIATION O CTOBER 2009 – N IAGARA - ON - THE L AKE I NADEQUACY OF W IND T URBINE N OISE R EGULATIONS AND THEIR A PPLICATION John P Harrison Physics Department, Queen’s University, Kingston, ON K7L 3N6 harrisjp@physics.queensu.ca 1. INTRODUCTION 
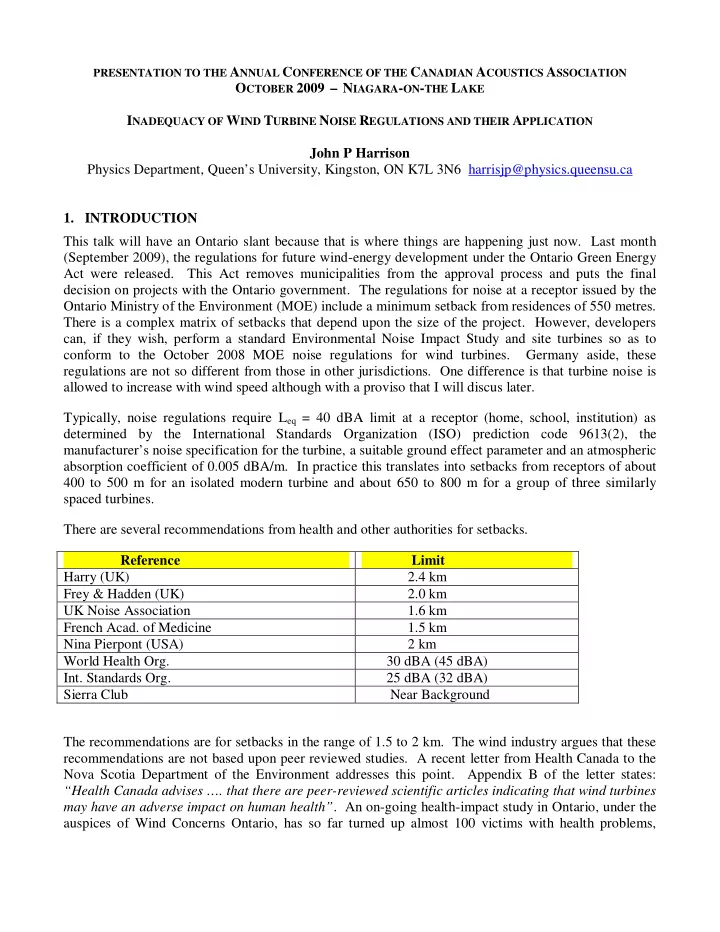
This talk will have an Ontario slant because that is where things are happening just now. Last month (September 2009), the regulations for future wind-energy development under the Ontario Green Energy Act were released. This Act removes municipalities from the approval process and puts the final decision on projects with the Ontario government. The regulations for noise at a receptor issued by the Ontario Ministry of the Environment (MOE) include a minimum setback from residences of 550 metres. There is a complex matrix of setbacks that depend upon the size of the project. However, developers can, if they wish, perform a standard Environmental Noise Impact Study and site turbines so as to conform to the October 2008 MOE noise regulations for wind turbines. Germany aside, these regulations are not so different from those in other jurisdictions. One difference is that turbine noise is allowed to increase with wind speed although with a proviso that I will discus later. Typically, noise regulations require L eq = 40 dBA limit at a receptor (home, school, institution) as determined by the International Standards Organization (ISO) prediction code 9613(2), the manufacturer’s noise specification for the turbine, a suitable ground effect parameter and an atmospheric absorption coefficient of 0.005 dBA/m. In practice this translates into setbacks from receptors of about 400 to 500 m for an isolated modern turbine and about 650 to 800 m for a group of three similarly spaced turbines. There are several recommendations from health and other authorities for setbacks. Reference Limit Harry (UK) 2.4 km Frey & Hadden (UK) 2.0 km UK Noise Association 1.6 km French Acad. of Medicine 1.5 km Nina Pierpont (USA) 2 km World Health Org. 30 dBA (45 dBA) Int. Standards Org. 25 dBA (32 dBA) Sierra Club Near Background The recommendations are for setbacks in the range of 1.5 to 2 km. The wind industry argues that these recommendations are not based upon peer reviewed studies. A recent letter from Health Canada to the Nova Scotia Department of the Environment addresses this point. Appendix B of the letter states: “Health Canada advises …. that there are peer-reviewed scientific articles indicating that wind turbines may have an adverse impact on human health” . An on-going health-impact study in Ontario, under the auspices of Wind Concerns Ontario, has so far turned up almost 100 victims with health problems,

  2. caused by the proximity, pre-approved by the MOE, of one or more turbines to their homes. I have read some of the victim statements; they are shocking! Two field studies, one in Sweden and one in Wisconsin, have found annoyance with wind turbine noise at the 40 dBA level among 50% of respondents; this compares with 3 to 4% for traffic noise at 40 dBA. It is clear that the turbine-noise limits and their application are too lenient to the wind industry and that changes are needed if wind- energy development is to continue to expand. This paper discusses the basis for the inadequacy. 2. INADEQUACIES The myth of masking from ground level wind noise seems to have been laid to rest thanks to the pioneering work of van den Berg (2004) and the myriad measurements that have demonstrated the large wind speed gradient in the atmosphere at night. This means that turbines can be operating at close to full power and maximum noise output with very little wind and hence masking noise at ground level. The October 2008 regulations required a developer to include wind speed gradient measurements in the Environmental Review Report. Of the two ERR’s that I have seen since then, both quoted gradient parameters above 0.4 for summer night-time, far in excess of the 0.2 value implicit in the previous regulations. Van den Berg has been vindicated. Bill Palmer has been vindicated. However, hundreds of turbines had been sited based upon the old regulation; why did it take 4 years for an untenable regulation to be rectified by MOE? For those people living with the reduced setbacks that resulted from the earlier regulation the noise problem will remain until the offending turbines are shut down. The remaining problems are concerned with the large intrusion of turbine noise above ambient, the characteristic swooshing sound of an operating turbine, the excess low-frequency noise due to turbulent inflow and the neglect of uncertainty in noise prediction. 2.1 Intrusion Rural regions are very quiet, probably below 25 dBA at night. This means that typical guidelines are allowing a 15 dBA intrusion above background and, given the annoying characteristic of turbine noise, this is too much. There is no need to allow this large an intrusion. Germany, which has a population density 20 times larger than that of Ontario and has a well-developed wind energy generation system supplying 6.4% of its electrical energy, has a night-time noise limit of 35 dBA. In another instance, New Zealand, in section 5.3.1 of its draft regulations, is introducing a secondary noise limit of 35 dBA for evening and night-time in low background environments. 2.2 Amplitude Modulation Wind turbine noise is periodic in the blade passage frequency. It is clear from the work of van den Berg (2005). It is clear from the Salford report (Moorhouse et al 2007) published by the British Wind Energy Authority. It is acknowledged by MOE in its turbine noise regulations published in October 2008. Even Dr. Leventhall, a frequent consultant to the wind industry, has written: “A time-varying sound is more annoying than a steady sound of the same average level and this is accounted for by reducing the permitted level of wind turbine noise” . The consensus is that it amounts to about 5 dBA of amplitude modulation. This amplitude modulation is averaged away by regulations based upon L eq . However, the ear does not average and this swooshing sound adds significantly to the annoyance associated with turbine noise. A 5 dBA penalty is needed to account for the amplitude modulation.

  3. 2.3 Turbulence Many noise complaints draw attention to a component that sounds like a rumble (a dryer or a passing train that never passes!). Some victims cannot bear to put their heads down on their pillows because of the vibration. This is probably excess low frequency noise and vibration associated with turbulent inflow of air into the blades. The turbulence has two sources, turbulence in the atmosphere and the turbulent wake from neighbouring turbines. Atmospheric turbulence, like wind speed, is a variable. However, it can be measured and average values quantified as a function of time of day and/or season of the year. Turbine-induced turbulence can and has been measured. SODAR (sound equivalent of radar) measurements have shown that for x/D ~ 5, the turbulent intensity behind a turbine is comparable to the atmospheric turbulent intensity (x is the distance behind the blade and D is the blade diameter). They were 5% and 7% respectively. Turbulent intens ity is defined as σ/v where σ is the standard deviation of the wind speed v. The SODAR measurements were made every minute and the averaging time for σ and v was 10 minutes. Low frequency noise requires a faster time scale for the calculation of σ and hence of the appropriate turbulent intensity. I note that for the Wolfe Island wind farm in Ontario about half of the turbines are within 6 blade diameters of an upwind turbine for the prevailing south-west winds. As an aside, the velocity deficit for the same half of the turbines due to the wake of the upwind neighbours will be up to 20% (Barthelmie 2003), so lowering the power output efficiency from that of the upwind turbines! Moriarty and Migliore working at the National Renewable Energy Laboratory in Golden CO, made a study of inflow turbulence noise from turbines, with both measurements and predictions. The figure shows their results as sound pressure level as a function of sound frequency for a measuring site downwind of a test turbine. Various aerodynamic mechanisms contribute to the noise. All but the open diamonds correspond to predictions for the various mechanisms operating in a stable atmosphere. The open diamonds represent the predicted excess noise for the blades turning in turbulent air with a turbulent intensity corresponding to that measured. The red line is the sum of all these contributions. The blue diamonds are the measurements of the turbine noise. The agreement between the predicted and measured noise is compelling. Below 1 kHz, the turbulent inflow noise can dominate the total turbine noise. For instance, with a turbulent intensity of I = 10.6%, at 100 Hz this noise is 30 dBA larger than the combined noise from all

Download Presentation
Download Policy: The content available on the website is offered to you 'AS IS' for your personal information and use only. It cannot be commercialized, licensed, or distributed on other websites without prior consent from the author. To download a presentation, simply click this link. If you encounter any difficulties during the download process, it's possible that the publisher has removed the file from their server.

Recommend


More recommend