
SLIDE 1
Nutrition and Feeding of Fish
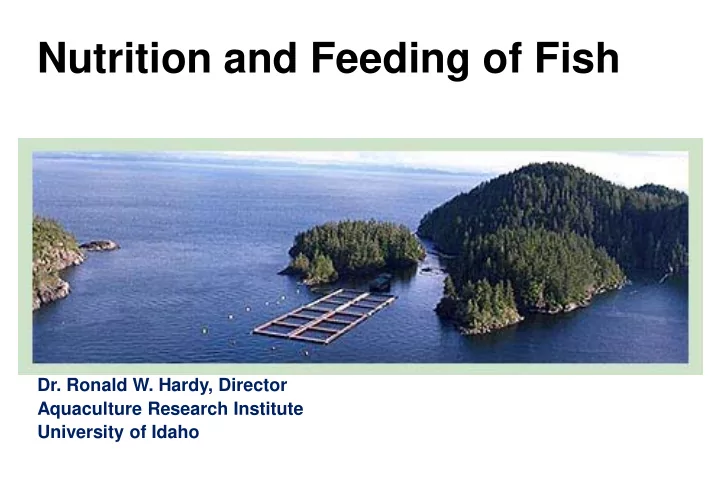
- Dr. Ronald W. Hardy, Director
Aquaculture Research Institute University of Idaho
Nutrition and Feeding of Fish Dr. Ronald W. Hardy, Director - - PowerPoint PPT Presentation
Nutrition and Feeding of Fish Dr. Ronald W. Hardy, Director Aquaculture Research Institute University of Idaho Nutritional issues in aquaculture Sustainability Finding alternatives to fishmeal and fish oil Increasing diet efficiency
Aquaculture Research Institute University of Idaho
– Rapid and economical growth – Low economic feed conversion ratios
cost to include such an ingredient is justified by increased performance
– For salmon, this means healthy and robust smolts
– Cost of feed is secondary to smolt quality
– Economical growth for food fish – Targeted final weight for hatchery smolts – Can be ad libitum, percent per day, programmed, etc.
Demand feeders in Idaho trout farm Programmed feeding system at Clear Springs Foods, Idaho
– Each stave represents level of an essential nutrient
– Level of limiting nutrient determines growth rate
– Maize (corn) protein is low in lysine – Soy protein low in methionine
Increase methionine to here
– Cleanliness, good ventilation, outdoor air and sunlight (Florence Nightingale)
– Short latency to develop clinical signs of deficiency – Single disease or clinical condition associated with dietary deficiency – Clinical condition could be cured at a certain dietary intake level
– Combining Leibig’s barrel with the single nutrient – single disease model
– Enzyme activity when a specific vitamin or mineral was an essential co-factor – Tissue nutrient levels above minimum threshold associated with clinical deficiency, such as whole body or vertebral phosphorus level
Tuna farm in Mexico Idaho trout farm
In 1924, Embody & Gordon, from Cornell University got funded to go on a fishing trip from NY to MN to examine the stomach contents of trout
Ingredient Percent in diet
Proximate category Percent
Moisture 28-30 Crude protein 34 Fat 17 Ash 5
requirement level (1950’s through today)
measure activity of enzymes that require essential nutrient as co-factor (same assumption, 1980’s)
expression and single gene products in tissues)
rearing water
Stage of feeding Dietary protein (%)
Atlantic Salmon Common Carp Rohu Tilapia Channel Catfish Rainbow Trout Pacific Salmon
Arginine
1 .8 1 .7 1 .7 1 .2 1 .2 1 .5 2 .2
Histidine
0 .8 0 .5 0 .9 1 .0 0 .6 0 .8 0 .7
I soleucine
1 .1 1 .0 1 .0 1 .0 0 .8 1 .1 1 .0
Leucine
1 .5 1 .4 1 .5 1 .9 1 .3 1 .5 1 .6
Lysine
2 .4 2 .2 2 .3 1 .6 1 .6 2 .4 2 .2
Methionine
0 .7 0 .7 0 .7 0 .7 0 .6 0 .7 0 .7
Methionine+ cystine
1 .1 1 .0 1 .0 1 .0 0 .9 1 .1 1 .1
Phenylalanine
0 .9 1 .3 0 .9 1 .1 0 .7 0 .9 0 .9
Threonine
1 .1 1 .5 1 .6 1 .6 1 .6 1 .8 1 .8
Tryptophan
0 .3 0 .3 0 .4 0 .3 0 .2 0 .3 0 .3
Valine
1 .2 1 .4 1 .5 1 .5 0 .8 1 .2 1 .2
The chart is complete but some of the values are based on studies conducted 50 years ago and most are with fingerling fish. The values shown are recommendations for normal growth under normal conditions and assume 100% availability.
Yellowtail Red Drum European Sea Bass Japanese Flounder Grouper Asian Sea Bass Cobia
Arginine
1 .6 1 .8 1 .8 2 .0 1 .8
Histidine I soleucine Leucine Lysine
1 .9 1 .7 2 .2 2 .6 2 .8 2 .1 2 .3
Methionine
0 .8 0 .8 0 .9 0 .8 0 .8
Methionine+ cystine
1 .2 1 .2 1 .0 1 .2 1 .1
Phenylalanine Threonine
0 .8 1 .2
Tryptophan
0 .3
Valine Taurine
R R 0 .2 R R R R
The chart shows many voids, but does include levels for most of the critical limiting amino acids. The values shown are recommendations for normal growth under normal conditions and assume 100% availability
Fatty acid Herring oil Menhaden oil Pollock oil C20:5n-3 5.5 10.2 13.1 C:22:6n-3 3.9 12.8 6.8 Total n-3 12.4 25.8 25.4 Amount needed in diet to supply 1% omega-3: 8% 4% 4%
Vitamin Primary function
12
Vitamin Anorexia Primary deficiency signs
Vitamin A Yes Vision problems Vitamin D Yes Impaired bone calcification Vitamin E Yes Anemia, ascites, membrane fragility Vitamin K No Anemia, prolonged prothrombin time Thiamin Yes Hyperirritability, convulsions Riboflavin Yes Lens cataracts Pyridoxine Yes Convulsions, erratic swimming Pantothenic acid Yes Clubbed gills Niacin Yes Skin lesions Biotin Yes Muscle atrophy Folic acid Yes Macrocytic anemia Vitamin B12 No Anemia Inositol Yes Choline Yes Ascorbic acid Yes Lordosis, scoliosis, hemorrages
Vitamin Salmon Trout Vitamin A 2500 2500 Vitamin D 2400 2400 Vitamin E 50 50 Vitamin K unknown unknown Thiamin 1 unknown Riboflavin 7 4 Pyridoxine 6 3 Pantothenic acid 20 20 Niacin unknown 10 Biotin unknown 0.15 Folic acid 2 1 Vitamin B12 0.01 0.01 Ascorbic acid 50 50 Choline 800 1000 myo-Inositol 300 300
(IU or mg/kg dry diet)
Yellowtail Red Drum European Sea Bass Japanese Flounder Grouper Asian Sea Bass Cobia
m g/ kg Thiam in
1 1
Riboflavin
1 1
Pyridoxine ( B6 )
1 2
Pantothenic acid
3 6
Niacin
1 2
Biotin
0 .6 7
Cyanocobalom ine ( B1 2 )
0 .0 5
Folate
1 .2
Choline
1 0 0 0 6 0 0 7 0 0
Myoinositol
4 2 0 3 5 0
Ascorbic acid ( C)
4 3 -5 2 1 5 2 0 1 8 3 0 4 5 -5 4
Water soluble vitamin requirements were only available for the yellowtail. Again, vast areas for new research needs are apparent. Values are for fish reared in laboratory settings, not in commercial aquaculture.
Yellowtail Red Drum European Sea Bass Japanese Flounder Grouper Asian Sea Bass Cobia
Fat Soluble Vitam ins A ( I U/ kg diet)
5 .6 3 1 2 .7 0 .9
D ( I U/ kg diet) E ( mg/ kg diet)
1 1 9 3 1 1 1 5
Lipids n-3 PUFA %
2 .0 -3 .9 0 .5 -1 .0 1 .0 1 .4 1 .0
Phospholipids %
2 .0 -3 .0 7 .0
1 8 :3 n-3 %
Fat-soluble vitamin requirements have been listed for most of these species, and general lipid requirements for the polyunsaturated fatty acids have been studied during the past 10 years
The apparent requirement can be calculated from maximum growth, maximum enzyme activity, or at maximum tissue stores Gene expression?
Requirement* Comments
15-20 ppm Prevents deficiency signs 250-500 ppm Supports maximum wound healing activity 1000-2500 ppm Supports maximum disease resistance in laboratory challenges >2500 ppm Maximum tissue storage levels and max. immune response
* When included in purified diet, with ideal conditions and no oxidation of vitamin C
– crowding, water quality, pathogen load etc.
1 2 3 4 5 6 4 8 12 16 20 24 28 32 TPP (ug/g liver tissue) weeks of feeding (initial fish weight 125 g)
complete deficient
0.0 0.2 0.4 0.6 0.8 1.0 1.2 1.4 4 8 12 16 20 24 28 32 TPP (ug/ml packed RBCs) Weeks of feeding (initial fish weight 125 g)
complete deficiency
Macrominerals (g/kg diet) Microminerals (mg/kg diet) (trace elements)
* Required in the diet, but not always supplemented in practical feeds
Bone, scale, skin, muscle function
Bone, scale, skin, phospholipids
Bone, scale, skin, muscle function
Ionic balance (with Cl-)
Hemoglobin
Cofactor for enzyme activity
co-factor for glutathione peroxidase (protection against free radicals)
Cofactor for enzyme activity
salmon & trout feeds were made at the hatchery
locally-available materials were used
wet feeds & wet/dry mixtures were used
mixtures were formed into clumps or noodles
feed made from animal organs, old horses, carp & suckers, plus dry blends (dried milk, yeast, wheat)
Ingredient Percent in diet
Proximate category Percent
Moisture 9 Crude protein 42 Fat 6 Ash 8
Ingredient Percent in diet
remainder
Proximate category Percent
Moisture 28-30 Crude protein 37 Fat 13 Ash 7
Ingredient Percent in diet
Proximate category Percent
Moisture 8 Crude protein 52 Fat 16 Ash 12
Pellet buoyancy can be controlled, so less feed waste from feed falling through nets
harder pellets, less fines than compressed pellets
more fish oil can be added by top-dressing
Ingredient (%) Salmon Trout Fish meal 25 15 Soybean products 20 12 Animal by-product meals 15 Cereal products 10 25 Gluten products 15 15 Vitamins/ minerals 3 2 Fish/plant oil 25 15 Others 2 1 Crude protein (%) 44 44 Crude lipid (%) 35 20
)
10 20 30 40 50
1970 1980 1990 2000 2010
Protein Digestible Protein Fat
10 20 30 40 50 60
1960s1970s1980s1990s 2000 2010
Protein Digestible Protein Fat
0.5 1 1.5 2 2.5 1970 1975 1980 1985 1990 1995 2000 2010
Salmon Trout
storage stability)
fingerlings)
0.0 0.5 1.0 1.5 2.0 2.5 3.0 3.5
1 2 3 4 5 6 7
Fish weight and feed used Fish weight Feed used
Start of grow-out
0.8 1 1.2 1.4 0.00 0.50 1.00 1.50 2.00 2.50 3.00 3.50 4.00 4.50 700 800 900 1000 FCR Feed cost per 3.2kg fish Feed cost ($/mt)
0.8 1 1.2 1.4
10 20 30 40 50 60 70 1995 1997 1999 2001 2003 2005 2007 2009 2011 Percent FM in feeds Tonnes FM used (x104)
– From $400-$800 mt-1 to $1600 mt-1 – This drove a 50% reduction in use levels in fish feeds
0.00 0.50 1.00 1.50 2.00
Asx Glx Ser Thr Lys Arg His CSN Tau Phe Tyr Val Leu Ile Ala Met Gly
FM SPI
0.00 0.50 1.00 1.50 2.00
Asx Glx Ser Thr Lys Arg His CSN Tau Phe Tyr Val Leu Ile Ala Met Gly
FM SPI
50 100 150 200 250 300 350 USDA/UI Selected Strain Fish Lake Stocking Strain Fishmeal Diet Plant Protein Blend Diet
0.7 0.75 0.8 0.85 0.9 0.95
UI/USDA Selected Strain Fish Lake Stocking Strain
Fish Meal Diet Plant Protein Blend Diet
– Growth improved but… feed efficiency is lower
– In the spider diagram, some AAs were higher than levels in fishmeal
– Protein (amino acids) being used to supply metabolic energy to cells – Oxidative stress to cells – Signaling activity of amino acids that can enhance protein anabolism or protein catabolism, depending on the amino acid
Catabolic processes Anabolic processes
BCAT2 KLF15
BCAA degradation
Rheb
Protein Translation
Akt PI3K Insulin / IGF-1
REDD1
Ubiquitin- proteosome dependent protein degradation Autophagy
NR3C1 Atrogin -1 MuRF1 FoxOs
LC3 Bnip3
Glucocorticoids
Catabolic processes Anabolic processes
BCAA
BCAT2 KLF15
BCAA degradation
Rheb
Protein Translation Akt PI3K Insulin / IGF-1
REDD1
Ubiquitin- proteosome dependent protein degradation Autophagy
NR3C 1 Atrogin -1 MuRF1 FoxOs
LC3 Bnip3
Glucocorticoids
– We found that dietary protein source modified TOR and REDD-1 transcriptional activities , reducing anabolic processes – No detectable effects on TOR associated with BCAA levels in diets
– We sampled fish at 3, 6, 12, 18 and 24 hours after single feeding – HPV data shows AA absorption in the intestine – CV data shows availability of AAs at peripheral tissues (muscle) and also indicates AA catabolism and protein turnover – We also measured gene expression levels of intestinal AA transporters
2 trout strains:
Force feeding (0.5%BW):
Ingredient Percent in diet
Soy protein concentrate 25.63 Soybean meal 19.55 Corn protein concentrate 17.54 Wheat gluten meal 4.07
Wheat starch 8.91 Fish oil 15.70
L-Lysine 1.40 DL-Methionine 0.38 Threonine 0.20
Taurine 0.50 Mono-dicalcium phosphate 3.33 Potassium chloride 0.56 Sodium chloride 0.28 Magnesium oxide 0.05 Stay-C 0.20 Choline chloride 0.60 Trace mineral premix 0.10 Astaxanthin 0.06 Vitamin premix 702 1.00
Selection Diet
Lys, Met, Thr SPC, SBM, CPC, WG
Intestine Stomach Liver
Feed pellet
Intestine Stomach Liver
Intestine Stomach Liver
Intestine Stomach Liver
synthesis and protein turnover
and protein turnover
selected trout
– Differences between trout strains in timing and pattern of amino acids in hepatic portal vein – The selected strain showed a major peak at 3h followed by a similar decreasing pattern for all AAs
shifting the timing of peaks (AA signaling)
protein turnover
– The pattern of lysine over time followed different patterns between strains – Increased lysine in CV samples after 18 hrs suggest higher protein turnover in non- selected strains
– Supplementing AAs to ‘balance’ the diet does not correct the problem with low protein retention in plant-based diets in commercial (non-selected) stains – But…the selected strain has overcome the problems that AA supplementation and plant (soy) protein digestion present
Populations Organism Organ/Cell
Proteome
Genome Gene
Growth performance, health, survival Shifts in metabolism
Gene expression Higher hatchery returns
– Feed composition – Early life history (epigenetics) – Supplements to increase survival and ability to resist pathogens