
SLIDE 1
Nottinghams Chinese Community Cohesion and Integration: Survey - - PDF document
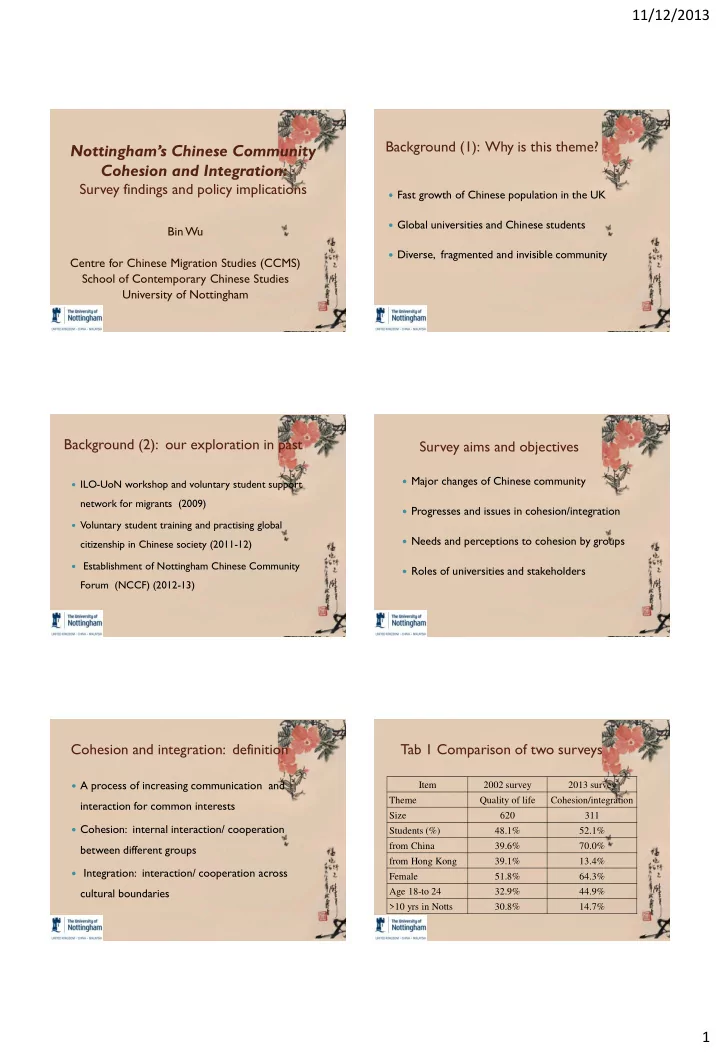
11/12/2013 Background (1): Why is this theme? Nottinghams Chinese Community Cohesion and Integration: Survey findings and policy implications Fast growth of Chinese population in the UK Global universities and Chinese students Bin
Students 40% Residents 60%
10 20 30 40 50 60 S dialect D dialect D identity N-Chinese PRC Other
10 20 30 40 50 60 Relatives S identiy D identity N-Chinese PRC Other
0% 10% 20% 30% 40% 50% Study here Job here Return home No Yes