SLIDE 1 Non-Contact Electrical Resistivity Techniques
Farzad Hayati, Ting Yan, Alexandra Gerea, Andrei Mihai and Phil Atkins
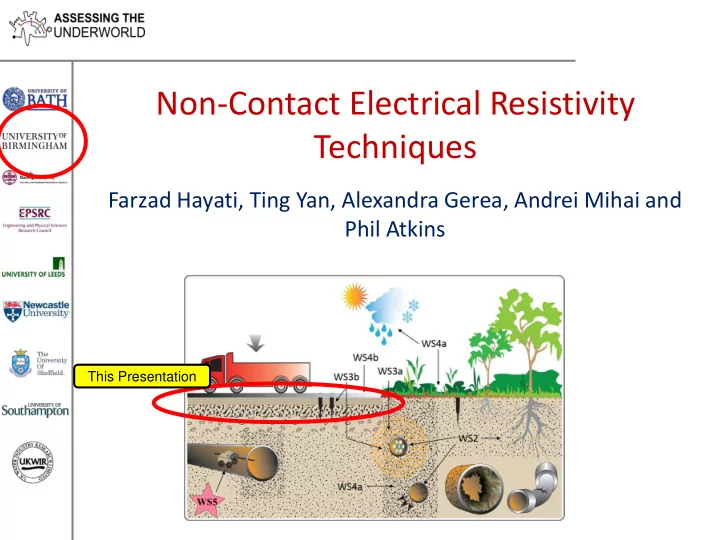
This Presentation
SLIDE 2 As an overarching desire, we have four areas of interest: 1. Could we reveal the extent of tree root structures? 2. Could we determine the depth of cracks, or detect cracks and voids that are not visible at the surface? 3. Could we detect wet areas under paved surfaces, possibly originating from leaks or poor drainage? 4. What would happen if we used smaller and smaller mobile sensors?
Outline
All need some form of non- contact, non-invasive sensor
SLIDE 3
Perhaps?
Perhaps we have developed a very simple, low-cost, hand-held instrument that can measure surface roughness and moisture retention?
SLIDE 4
Our Original Idea
Hypothesis A : A road surface …. Can be modelled electrically as: Hypothesis B: A good condition asphalt is highly resistive with low values of capacitance ( low permittivity) …. Hypothesis C: A crack, or void, is water filled with lower resistivity and higher values of capacitance ( increased permittivity) ….
SLIDE 5 Our Original Idea
Hypothesis Testing Take a device capable of measuring resistivity and permittivity Construct a non-contact, Wenner electrical resistivity
electrical current is injected into the ground using small capacitor plates. The electric field is sensed using two similar capacitor plates. Boxed-up and shielded using a kitchen baking tray, it should be capable of detecting changes in the top 10 cm of the asphalt.
SLIDE 6
Our First Measurements
Hypothesis Testing - Take a device capable of measuring resistivity and permittivity Use a high-quality new surface as a reference.
SLIDE 7 Our First Measurements
Now conduct test on a poorer surface – 40 year old ‘stripped’
The two data sets are separable – allowing automatic classification
SLIDE 8
Don’t Believe You - Two Lucky Results?
Show me surface alligator cracking! Interestingly, although the texture looked poor on the surface, the measurements indicated that it was not particularly damaged.
SLIDE 9 Our Early Measurements
The device was originally designed to be randomly pulled across an area
- f asphalt and obtain perhaps two statistical measures (roughness and
material composition). But could we image? Remediation bonds, cracks and stripping
SLIDE 10
Our Early Measurements
The apparent resistivity really does change quite markedly on this particular surface. There is always a problem with visualising the data in a way that is acceptable to the user. But what causes this?
SLIDE 11
Our Early Measurements
Or, with an alternative form of visualisation
SLIDE 12
Automation
The original measurements were conducted manually – this was slow, tedious and error-prone. So we automated the process with a bit of modern-day carpentry.
SLIDE 13
Automation
The first version operating in the field. This shook itself apart after a week.
SLIDE 14
Automation
The second version operating in the field.
SLIDE 15
Automation
The results:
SLIDE 16
Typical Larger-Scale Results
But field trial results should have solid scientific underpinnings.
SLIDE 17 Laboratory Verification
Are we fooling ourselves? We need a laboratory ‘truth data’ environment. One can buy large lumps of conductors (aluminium billets) and large lumps
- f insulators (plastic stock) – but nothing in-between.
We had a large lump of carbon-loaded foam
- manufactured. The resistivity was measured
using a Wenner array – an interesting material.
SLIDE 18
Laboratory Verification
Use a British Standard laboratory weight to ensure electrical contact with the foam.
SLIDE 19
Laboratory Verification
Our electrodes are large plates, so all conventional mathematical predictions fall-apart. Use the foam to compare our new predictions with the ‘truth data’ resistivity of the foam.
SLIDE 20
Laboratory Verification
Turn the electrodes over to obtain direct (galvanic) contact with the foam. The good news – the results agreed with the conventional measurement of resistivity.
SLIDE 21 Laboratory Verification
Finally, use our non-contact, capacitively-coupled sensor to measure the
- resistivity. The even better news – the results from this sensor agreed with
the conventional measurement of resistivity. So we are pretty sure that we can measure something related to surface moisture content.
SLIDE 22
Laboratory Verification (Roughness)
We have constructed both analytic and practical models of surface roughness within the laboratory.
SLIDE 23
Field Surface Roughness Measurements
A non-contact, laser displacement probe was used to measure asphalt surface roughness over a 1 m scan.
SLIDE 24
Field Surface Roughness Measurements
The surface roughness scans can be reduced to a Probability Density Function (PDF). New surfaces appear to have a ‘tight’ Probability Density Function with much less variation in surface height. Older (stripped) surfaces have far greater variation.
SLIDE 25
Rolling It All Together: Measured Impedances
The simple measurement of impedance appears to tell us about both the roughness and the electrical conductance (water content?) of asphalt surfaces.
Rough Smooth Dry Wet Old surface near a damp patch New, good- condition surface
SLIDE 26 Conclusions
1. A new non-contact, induced-polarization device has been built. This is capable of measuring magnitude and phase of the apparent resistivity (the impedance). 2. Multiple field and laboratory trials have been conducted and repeated
- ver different asphalt surfaces.
3. Trials results have been presented showing that automatic classification separation appears possible. This all looks rather good ….