
SLIDE 1
7/18/2014 1
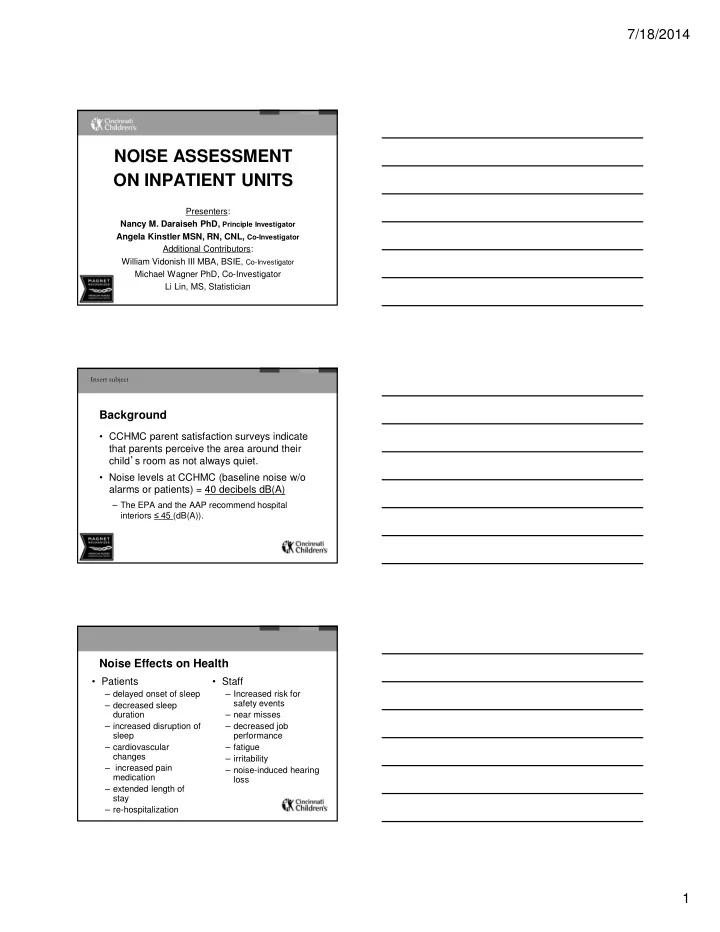
NOISE ASSESSMENT ON INPATIENT UNITS
Presenters: Nancy M. Daraiseh PhD, Principle Investigator Angela Kinstler MSN, RN, CNL, Co-Investigator Additional Contributors: William Vidonish III MBA, BSIE, Co-Investigator Michael Wagner PhD, Co-Investigator Li Lin, MS, Statistician
Background
- CCHMC parent satisfaction surveys indicate
that parents perceive the area around their child’s room as not always quiet.
- Noise levels at CCHMC (baseline noise w/o
alarms or patients) = 40 decibels dB(A)
– The EPA and the AAP recommend hospital interiors 45 (dB(A)).
- Noise Effects on Health
- Patients
– delayed onset of sleep – decreased sleep duration – increased disruption of sleep – cardiovascular changes – increased pain medication – extended length of stay – re-hospitalization
- Staff