
SLIDE 1
12/24/2014 1
Nitrogen in the Soil
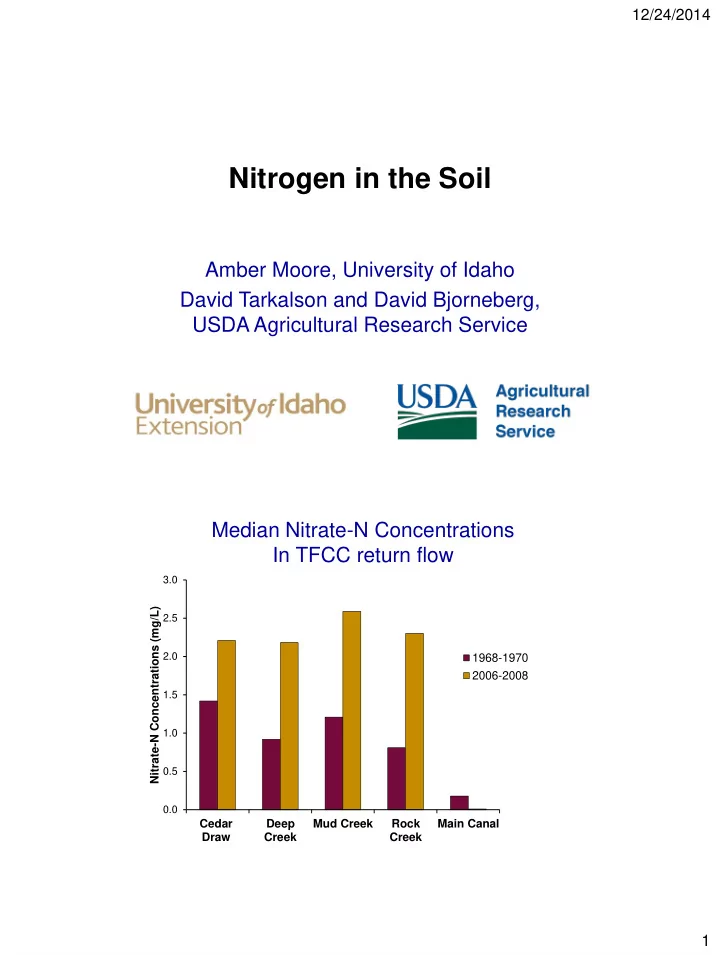
Amber Moore, University of Idaho David Tarkalson and David Bjorneberg, USDA Agricultural Research Service Median Nitrate-N Concentrations In TFCC return flow
0.0 0.5 1.0 1.5 2.0 2.5 3.0
Cedar Draw Deep Creek Mud Creek Rock Creek Main Canal Nitrate-N Concentrations (mg/L) 1968-1970 2006-2008