SLIDE 1
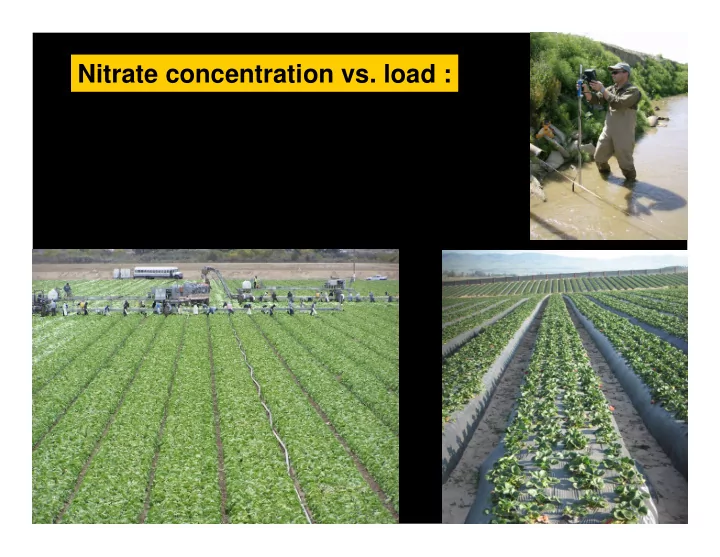
Nitrate concentration vs. load :
SLIDE 2
Management options that growers have to address the nitrate problem (primarily irrigation upgrades and fertilizer rate reduction) can reduce nitrate loading, but may not produce an equivalent reduction in surface water nitrate concentration Focusing on nitrate concentration of surface water, particularly in creeks and drains comprised mostly of irrigation runoff and ag drainage, may miss significant reduction in nitrogen loading
Nitrate concentration vs. load :
SLIDE 3
Practical limitations on reducing surface water nitrate concentration :
much of the nitrate in irrigation runoff is from the well water there is no on-farm practice to consistently remove nitrate in runoff
SLIDE 4
SLIDE 5 10 20 30 40 50 60
1 2 3 4 5 Ave Field PPM NO3-N
well water field runoff
SLIDE 6
SLIDE 7
7 2 Vegetated ditch 6 2 Bare ditch 2008 2007 Runoff NO3-N (PPM)
SLIDE 8
SLIDE 9
Practical limitations on reducing surface water nitrate concentration:
Surface water influenced by root zone solution will be persistently high, because root zone nitrate must be persistently high Salinity control requires some water movement out of the root zone
SLIDE 10
Lettuce example:
Requires uptake of 120 lb N/acre to achieve maximum yield Transpires 8 inches of water over the season Since most N uptake occurs with transpiration, and most uptake is in the nitrate form, the average NO3-N concentration of root zone soil water must be greater than 50 PPM
SLIDE 11
Water Electrical Conductivity (dS/m) 1 2 3 4 5 6 7 8 9 Biomass (Mg hectare-1) 5 10 15 20 25 30 35 40 45 50 SAR = 3 SAR = 10 Regression
Biomass = 46.5e-0.06ECw
Lettuce growth is affected by soil salinity
Salinity control requires some discharge from the root zone :
Strawberry is even more salt sensitive
SLIDE 12
Water Electrical Conductivity (dS/m) 1 2 3 4 5 6 7 8 9 Biomass (Mg hectare-1) 5 10 15 20 25 30 35 40 45 50 SAR = 3 SAR = 10 Regression
Biomass = 46.5e-0.06ECw
Salinity control requires some discharge from the root zone :
CSIP reclaimed water
Lettuce growth is affected by soil salinity
Strawberry is even more salt sensitive
SLIDE 13
Water Electrical Conductivity (dS/m) 1 2 3 4 5 6 7 8 9 Biomass (Mg hectare-1) 5 10 15 20 25 30 35 40 45 50 SAR = 3 SAR = 10 Regression
Biomass = 46.5e-0.06ECw
Salinity control requires some discharge from the root zone :
Santa Maria well water
Lettuce growth is affected by soil salinity
Strawberry is even more salt sensitive
SLIDE 14
In summary …
Growers can reduce nitrate loading through irrigation and fertilizer management, but meeting a concentration standard in all water discharges is impossible Using nitrate concentration as the sole focus of monitoring may undervalue agronomic improvements
SLIDE 15