
SLIDE 1
7/3/16 1
View from Rabobank
Bart IJntema Cavan, Ireland 7 March 2016
Around the world in 60 minutes
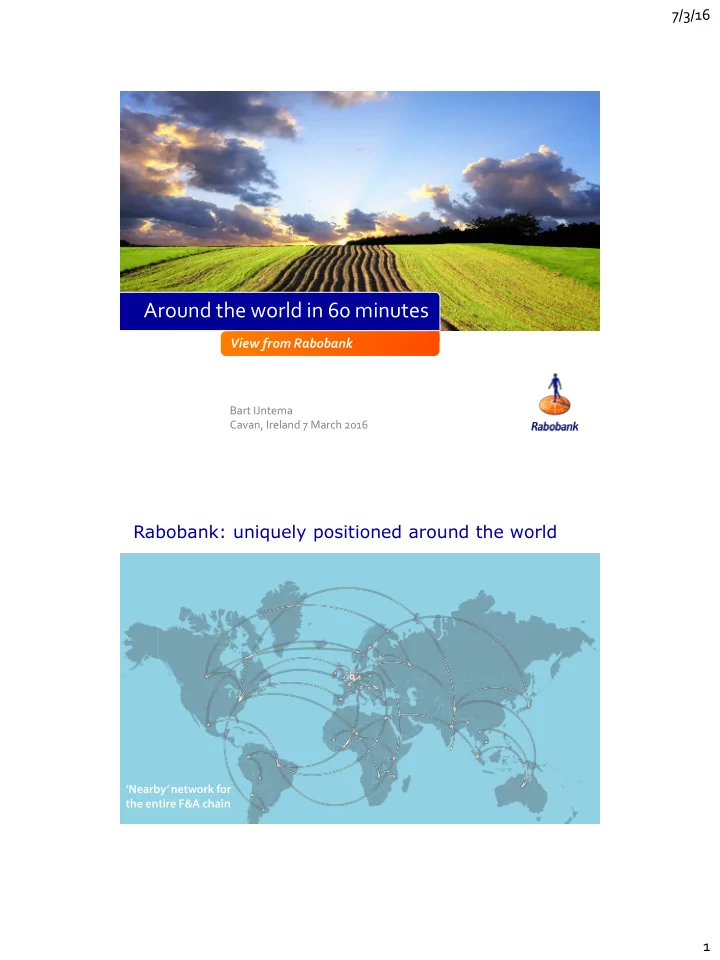
Rabobank: uniquely positioned around the world
‘Nearby’ network for the entire F&A chain
Around the world in 60 minutes View from Rabobank Bart IJntema - - PDF document
7/3/16 Around the world in 60 minutes View from Rabobank Bart IJntema Cavan, Ireland 7 March 2016 Rabobank: uniquely positioned around the world Nearby network for the entire F&A chain 1 7/3/16 Rabobank: uniquely positioned
7/3/16 1
View from Rabobank
Bart IJntema Cavan, Ireland 7 March 2016
Rabobank: uniquely positioned around the world
‘Nearby’ network for the entire F&A chain
7/3/16 2
Rabobank: uniquely positioned throughout the chain
From product centric, to customer centric , to value chain centric
FARM INPUTS PRIMARY SECTOR TRADE & EXPORT PROCESSING RETAIL
FAR, Global Sector Bankers building Global Relationships. F&A knowledgeable Relationship Managers building local relationships Markets, M&A, Products, Client Solutions
Rabobank: focussing on Food and Agri industry globally Committed through clear strategy: Banking for Food
DNA
7/3/16 3
Who is Bart?
Food and Farming in the spotlights...
7/3/16 4
Economical Societal
Relevance And of course… Building blocks Contribution Rabobank
Increase the availability of Food Improve access to food Stimulate balanced nutrition Enhance stability
Earth’s pin code is changing ...
Europe America Africa Asia
7/3/16 5
Importance
The world is growing with 5 million more mouths to feed every month
That’s a city the size of Singapore
Need to produce more with less ecological impact Agricultural land per capita has halved since the 1960’s
…But there is no equal distribution…
China & India together host 40% of the world population on 20% of the world’s arable land, with only 10% of the global renewable water resources
Africa3 China India Indonesia EU11 US+Canada Oceania Russia S+C America Other
Distribution of arable land
Africa3 China India Indonesia EU27 US+Canada Oceania Russia S+C America Other
distribution of population
Source: FAO, UN
10...implying that trade will increase
7/3/16 6 …And, World’s agricultural land is limited
... and declining... to 0.5 ha per capita in 2050?
2050 0.5 ?
11Importance
Almost 800 million people are chronically hungry … due to lack of know-how, improper handling, transportation
1/3
is wasted… New born inhabitants /min. Of which 154 from expanding populations in emerging and developing regions
7/3/16 7
... 95% of this growth towards 2050 will take place in developing regions: first Asia, >2030 Africa
Importance
More than 1.4 billion people are overweight, 1/3 of whom are obese Roughly one in every six Americans suffer from a foodborn disease Less than 5% of Dutch children eats the recommended daily amounts of fruits and vegetables
7/3/16 8
Importance
Price volatility is especially disadvantageous for people in developing regions who spend up to 75% of their income on food Prices of agricultural commodities remain volatile Risk and return are unevenly distributed throughout the chain Every 20 years the number of people depending on 1 farmer, doubles
More with less
7/3/16 9
More with Less: food loss and waste
About 1 out of 4 calories produced gets lost or wasted globally
Food loss and waste per capita (kcal/day)
1,600 1,200 800 400
Kcal/day In developed regions: much by consumer; in developing regions: much in supply chain
Macro economical relevance
Agro & Food sector:
and employment In 2030 the global food expenditure will have grown with
In 2050 the demand for food will have grown with at least
Conclusion: Abundance of opportunities?
7/3/16 10
End to commodity boom, but volatility to stay
19 50 100 150 200 250 300 350 400 450 500 200 400 600 800 1.000 1.200 1.400 1.600 1.800 2.000
GBP/tonne USDcents/bushel
Wheat CBOT Corn CBOT Soybeans CBOT Wheat UK
Exchange Rate Volatility Impacting Competitive Positions
20
60 70 80 90 100 110 120 130 140 150 160 3-1-2014 3-2-2014 3-3-2014 3-4-2014 3-5-2014 3-6-2014 3-7-2014 3-8-2014 3-9-2014 3-10-2014 3-11-2014 3-12-2014 3-1-2015 3-2-2015 3-3-2015 3-4-2015 3-5-2015 3-6-2015 3-7-2015 3-8-2015 3-9-2015 3-10-2015 3-11-2015 3-12-2015 3-1-2016 3-2-2016 3-3-2016 3-4-2016 3-5-2016 3-6-2016 3-7-2016 3-8-2016 3-9-2016 3-10-2016 3-11-2016 3-12-2016 Index exchange rate, Q3 2015 = 100 EUR AUD BRL GBP
7/3/16 11
Farmer crop plans vary worldwide
US (MidWest) France US (Great Plains) Brazil (Mato Grosso) Poland Australia (NSW)
Corn 50% Soybeans 50% Wheat 50% Fallow 50% Soy only 60% Soy + safrinha corn in the same year 40% wheat 56% barley 26% rapeseed 18% Wheat 72% Barley 14% Canola 14% Wheat 62% Barley 20% Corn 18%
Farmer margins down worldwide but not to the same degree
US (MidWest) France US (Great Plains) Brazil (Mato Grosso) Poland Australia (NSW)
1.000 1.500 2.000 2.500 '00-10 2011 2012 2013 2014 2015 2016 EUR/ha Gross margin Land rent Fuel costs Crop protection Seed Fertiliser
1.000 1.500 2.000 2.500 3.000 3.500 4.000 4.500 5.000 '04-10 2011 2012 2013 2014 2015 2016 PLN/ha gross margin land rent fuel costs crop protection seed fertiliser
200 300 400 500 600 700 800 900 1.000 '00-10 2011 2012 2013 2014 2015 2016 USD/ha Gross margin Land rent Fuel costs Crop protection Seed Fertiliser
1.000 1.500 2.000 2.500 3.000 3.500 '00-10 2011 2012 2013 2014 2015 2016 USD/ha Gross margin Land rent Fuel costs Crop protection Seed Fertiliser
200 300 400 500 600 700 800 03-10 2011 2012 2013 2014 2015 2016 AUD/ha margin Land rent Fuel costs Crop protection Seed Fertiliser
2.000 3.000 4.000 5.000 6.000 2010 2011 2012 2013 2014 2015 2016 BRL/ha Gross margin Land rent Fuel costs Crop protection Seed Fertiliser
7/3/16 12
23
Brazilian margins at high levels, but credit issues impact farming negatively
attractive farmer margins despite rising input costs
availability issues Australian margins are expected at acceptable levels
with a weakening Australian dollar are keeping Australia’s farmer margins at acceptable levels US shows another poor year in the Midwest and slight recovery in the Great Plains
in more than ten years
recover slightly due to higher yields while prices remain stable Dutch margins recovering, French margins stable but Polish margins touching lower levels
pressure, but still above the long term average.
Polish farmers, while recovery of potato prices supports Dutch margins
Summary outlook field crop margins
Brazil Australia US Europe
24
Global Outlook – Dairy
Currently low prices due to temporarily over supply. Re-balance in supply/demand and price expected in H2 2016.
forcing up global prices and accumulating considerable stocks.
imports from many dairy exporters.
milk has lead to an extended period of low prices which will continue until inventories are normalised and markets re- balance, this may take until 2H 2016.
7/3/16 13
25
Global Outlook Dairy – Supply
India will take the lead followed by USA, SA and EU. Land and environmental constraints in NZ and Netherlands
Source: Rabobank Analysisin worlds temperate regions where forage can be easily grown.
constraints will limit production growth in EU and NZ with more production growth in regions with more land available.
between 2014-2020 needed to satisfy the forecast demand.
generated within India with the support
Uruguay, Brazil) and the EU will also contribute significant supply growth.
0,0% 0,5% 1,0% 1,5% 2,0% 2,5% 3,0% 3,5% 4,0% CAGR Volume growth (2014-2020
5000 10000 15000 20000 25000 30000 35000 40000 45000 Absolute growth 2014-2020 (000 tonnes) Source: Rabobank Analysis
Expected rate of dairy supply growth 2014- 2020 by region Expected absolute dairy supply growth 2014-2020 by region
26
Global Outlook Dairy – Cost of production
Cost of production gap is closing, currency effect is large. Margin pressure greatest in NZ (environmental constraints and low milk price) and Netherlands (high fixed CoP)
production are important as multi- national companies retain their competitive position by procuring milk from lowest cost sources.
converging over time when considered
US$ terms. (The currency which dairy commodities are traded in) much of this convergence is the result of currency fluctuation.
2 4 6 8 10 US$ Comparison of production for 1Kg Milk Solids (US$) NZ Cost of production per Kg of MS (US$) NL Cost of production per Kg of MS (US$) 80 85 90 95 100 105 Index 2007 = 100 Comparison of production for 1Kg Milk Solids (index based on local currency) Index NZ Cost of production per Kg
Index NL Cost of production per Kg
0,10 0,20 0,30 0,40 0,50 0,60 0,70 USD per litre (standardised) Netherland s Upper Midwest California New Zealand
Development of cost of production in US$ terms in leading dairy supply regions (standard litre basis)
Source: Rabobank Analysis Source: Rabobank Analysis Source: Rabobank Analysis 7/3/16 14
27
Global Outlook Dairy – Price
Global dairy market to remain supply constrained. Milk price will follow cost of production
Uruguay, Brazil produce sufficient milk to create export surpluses. A few highly regulated markets (India and Canada) are broadly in balance while most are in deficit.
due to climate, lack of suitable land and/or skilled workforce. Expanding in regions with export surpluses difficult by lack of land and increasing environmental constraints. As a result the global dairy market is expected to remain supply constrained.
milk powder of between US$3500 and US$4000 will be required. This level is a move up from the trading range between 2010 – 2014 of US$3300 – US$3800.
Whole milk powder trading range
7/3/16 15
Fact based Intuitive time decisions
30
1.0 More precise
information
2.0 More informed
addressing within field variability
3.0 More fine-tuned
7/3/16 16
31
informed decisions
within field variability
circumstances and (expected) weather
32 Input manufacturers Input retailers (cooperative and private) Agronomists Farmers Offtakers (cooperative and private) Where to expect integration of inputs to an integrated farming solution?
7/3/16 17
33
34
Emerging situation Preferred situation
Farmers.. .. provide their data to databases.. .. that provide the basis for product development Competing on access to data / quality of database Farmers.. .. combine data in an anonymous database.. .. That provide the basis for product development Competing on quality of algorithm
7/3/16 18
35
1.
Create level playing field for developers of data-intensive solutions, sell data?
2.
Provide peer data to farmers
3.
Increase market transparancy, compare inputs on costs and benefits
4.
Support farmers in marketing decisions
5.
In the long run: take the lead in value chain transformation
The global food security challenge from a farmers perspective; Key topics and themes
36
7/3/16 19
Think and act differently; innovations and
Breed different Farm different Eat different? Think different? Live different?
Bart.IJntema@rabobank.com
38