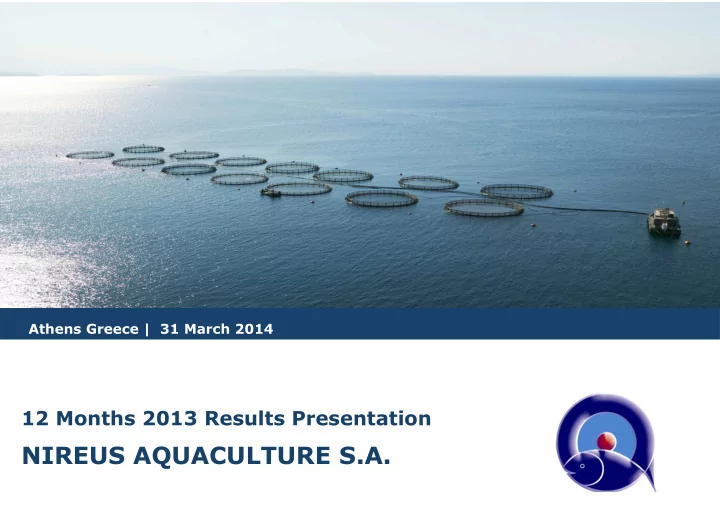

Athens�Greece�|��31�March�2014 12�Months�2013�Results�Presentation NIREUS�AQUACULTURE�S.A.
Main�events�12M�2013 � ������������������������������������������������������ ����� ������� ������ ��������������� � !��������������������"#���$ ���������������������%������������������ � &'����������������������������������(���� ������������� � )������������(*�* ����$ ���������������������'���������������$���������� ���������������������� � € 30�mi.�from�lower�fish�sales�prices– from�which�€ 10�mi.�correspond�to� lower�fish�sales�value�&�€ 20�mi.�to�lower�valuation�of�biomass � € 3mi.�from�higher�average�raw�material�prices�for�fish�feed� � € 24�mi.�from��lower�than�expected�growth�of�the�biological�assets � € 11.3 mi.�one off�provisions�of�from�which�€ 6.4�for�affiliates charged�to� financial�expenses�and�€ 4.9�mi.�for�customers � additional�deferred�taxes�€ 2.7�mi.�from�the�increase�of�the�corporate�tax� rate�to�26% 2 Key�points
Bass�&�bream�– Export�price�to�Italy�&�Spain ������������������������ ������������������������������ Source:��Kontali�analyse�“Seabass�&�Seabream�Feb�2014�monthly�report”� 3 External�Factors
Industry�supply�development The�expected�production�of� sea�bass�and�sea�bream�in� 2013,��versus�2012,�was: at�slightly�higher�levels • with�declining�growth • Prices�were�mostly�affected� by�the�liquidity�needs�of�the� sector 4 External�factors
Sales�by�Business�Sector�� Sales�by�sector�for�12M�2013� (%�distribution) !���� �������+� ����"�,���������������-����"% �� �����. /�����+��������������������������������������������������������� �00�������������1&�/�����2� ���� ��������3�������� Sales�of�fish�farming�down € 6.1�mi.�from�decline�in�average�weighted�price�&�reduced� juveniles�sales�– fish�volumes�up�+4% Feed�sales�up�+�€ 3.4�mi. Sales�of�aviculture,�animal�culture�products�&�equipment�down�€ 0.9�mi� 5 Sales�evolution
Exports�Evolution Exports�&�domestic�sales�distribution�(%) ���� ��� ��� ��� ��� ��� ��� ��� ��� ��� �� ���� ���� ���� ���� ���� ���� ���� Domestic�sales Εxports in� ���� € �45�40�4 �45�40�% Greece 46.57 44.38 EU 122.24 122.26 Other� 33.34 31.95 Exports�share�to�78%�of�total�sales� 6 Sales�evolution
Balance�Sheet Assets 12M�2013 12M�2012 in�mi.�€ 6��������6���������&3������� ��7�# ��7�� �������� %07(( %07(( 8�������������$������� (070� *%7�( /��������$������� ��7#� �*7�( Total�nonCcurrent 204,23 189,50 End�of�period� 8����������������� �0070� ���74� biological�assets� 9���������� �07(# �7�% value�lower�€ 70�mi.� ������:���������� #�7�% *#7�� /������������ �#7(� 447%� from:� ;����2��3��������� �7�# (7�� Total�current 184,50 280,91 • lower�fish�prices� Total�assets 388,73 470,40 • lower�than� expected�growth� Equity�and�liabilities 12M�2013 12M�2012 in�mi.�€ <�����������=��3���� �#7*� �#47�( )��$��������������������� ��������������� -�7�0. ���������� -*740. Total�shareholders'�equity� and�nonCcontrolling� interests 57,69 137,67 >?�����@����������� %�7%0 �*7%� A� ���������������'������������ *7(% ��70# /��������$������������������� �47*% ��7*# Total�nonCcurrent�liabilities 56,57 112,97 ������2��������������� ��74% �47*# ;����������@����������� ��%7*# �%�7�4 /������������������������ ��7(0 �*7�� Total�current�liabilities 274,48 219,76 Total�liabilities 331,05 332,74 Total�equity�and�liabilities 388,73 470,40 7 Financials
Income�Statement �������� 12M�2013 12M�2012 8����������<���� 149,47 158,92 )��$8����������<���� 49,11 43,24 Total�Sales 198,58 202,16 Effect�of�measurement�of�biological� Net�results�impacted�by: assets�at�fair�value�(*) ������������� (71,27) ��������� (11,51) • € 30�from lower�pricing :����������������������� ���������� -�0(7#%. �������� -�0#7��. <��������2������������'������ ������������ -%07�*. ��������� -%�7*4. • € 24 mi.�from�lower�than� %��������� ������������ ��� ������������ -��7��. ��������� -4#7#0. expected�biomass�growth /����������������'������ ������������ -%�7�4. ��������� -4�7�0. • € 3�mi.�from�higher�raw� /����������� ��������������� 47�4 ������������ %70� materials�cost�for�fish�feed EBITDA�before�biological�adjustment ������������� (13,80) ����������� 20,99 • OneCoff�provisions�of�€ 11.3 8������������,������� ������������ -#�7%�. ��������� -�#74(. mi.�from�which�€ 6.4�mi.�for� EBITDA�after�biological�adjustment ������������� (60,17) ������������� 6,73 Earnings�/�(loss)�before�interest� affiliates�and�€ 4.9�mi.�for� and�taxes�(EBIT) ������������� (67,74) ����������� (2,24) customers Earnings�/�(loss)�before�taxes�(EBT) ������������� (87,43) ��������� (16,17) • € 2.7�additional�deferred�tax� ��' ������������� ��7�* ������������ 474( from�the�increase�of�corporate� Earnings�/�(loss)�after�taxes�(EAT) ������������� (75,48) ��������� (13,89) tax�rate &3�������������� ����������� ������������ -(*70(. ��������� -�#70*. )��$��������������������� �������������� -07#�. ������������ 07�� &������������������-�. -�7�(��. -07440�. -B.��3�������-���������������"�����������$������������.�� ������������ �����������������������?�-������������ ���.��������������������9!:< 8 Financials
Recommend
More recommend