
SLIDE 1
Aquaculture needs you!
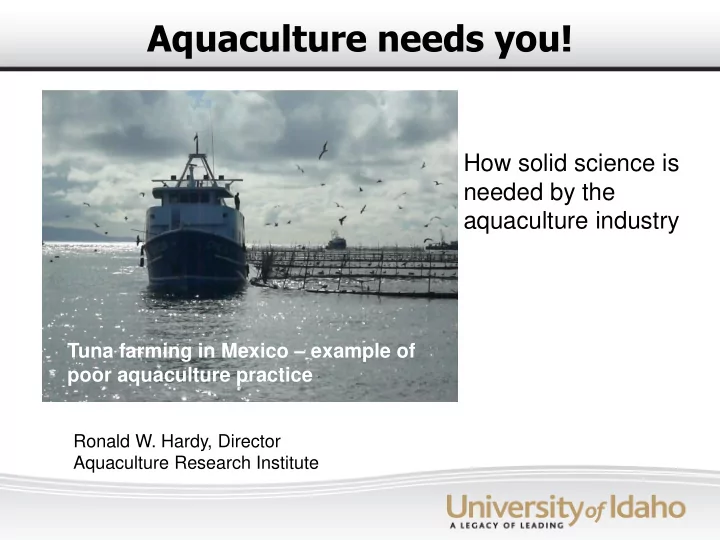
Ronald W. Hardy, Director Aquaculture Research Institute
How solid science is needed by the aquaculture industry
Tuna farming in Mexico – example of poor aquaculture practice
Aquaculture needs you! How solid science is needed by the - - PowerPoint PPT Presentation
Aquaculture needs you! How solid science is needed by the aquaculture industry Tuna farming in Mexico example of poor aquaculture practice Ronald W. Hardy, Director Aquaculture Research Institute Topics to be covered Global
Ronald W. Hardy, Director Aquaculture Research Institute
Tuna farming in Mexico – example of poor aquaculture practice
– Three examples: salmon, tilapia, shrimp
– Water resources – Feed resources
– Science-based and value-based approaches – Scientists must strive to improve aquaculture, being critical is not enough – Examples of current research in fish nutrition
Marine net pen Shrimp ponds Shellfish
Tuna farm in Mexico Idaho trout farm
worldwide
countries
US is half of this average
consists almost entirely of rice
50 100 150 200 250
Aquaculture Catch for food Fish meal
Million metric tons
Countries Production, metric tons (2006) China 34,429,122 India 3,123,135 Viet Nam 1,657,727 Thailand 1,385,801 Indonesia 1,292,899 Bangladesh 892,049 Chile 802,410 Japan 733,891 Norway 708,780 Philippines 623,369 United States ~500,000
10000000 20000000 30000000 40000000 China India Viet Nam Thailand Indonesia Bangladesh Chile Japan Norway Philippines USA
MMT
2,000,000 4,000,000 6,000,000 8,000,000 10,000,000 12,000,000
metric tons
Cereals 1,886 Sugar crops 1,580 Root and oilseed crops 1, 271 Fruits, vegetables and others 1,358
Milk and eggs 675 Meat and meat products 303
Fisheries landings 64 Aquaculture 51
10 20 30 40 50 60 70 80 90 Chicken Beef Pork Turkey Fish Lamb
per capita consumption
Chicken Beef Pork Turkey Fish Lamb
2000 2001 2002 2003 2004 2005 2006
Tuna 3.5 Shrimp 3.4 Shrimp 3.7 Shrimp 4.0 Shrimp 4.2 Shrimp 4.1 Shrimp 4.4 Shrimp 3.2 Tuna 2.9 Tuna 3.1 Tuna 3.4 Tuna 3.1 Tuna 3.1 Tuna 2.9 Pollock 1.6 Salmon 2.0 Salmon 2.0 Salmon 2.2 Salmon 2.2 Salmon 2.4 Salmon 2.0 Salmon 1.5 Pollock 1.2 Pollock 1.1 Pollock 1.7 Pollock 1.57 Pollock 1.5 Pollock 1.6 Catfish 1.1 Catfish 1.1 Catfish 1.1 Catfish 1.1 Catfish 1.1 Catfish 1.0 Tilapia 1.0 Cod 0.8 Cod 0.6 Cod 0.7 Cod 0.6 Tilapia 0.8 Tilapia 0.9 Catfish 0.97 Clams 0.5 Clams 0.5 Crab 0.6 Crab 0.6 Cod 0.6 Crab 0.6 Crab 0.66 Crab 0.4 Crab 0.4 Clams 0.5 Tilapia 0.6 Crab 0.6 Cod 0.6 Cod 0.5 Flatfish 0.4 Flatfish 0.4 Tilapia 0.5 Clams 0.5 Clams 0.5 Clams 0.4 Clams 0.4 Scallops 0.3 Tilapia 0.4 Flatfish 0.4 Scallops 0.3 Scallops 0.3 Scallops 0.3 Scallops 0.3 Tilapia 0.3
Farmed species in red
– More efficient feeds – Shorter production cycles – Lower losses to disease
– Eating more fish
– Healthful eating - beef consumption decreased, fish consumption increased
–
could be added in excess except one being studied – One vitamin at a time was added at various levels and fish response (growth, enzyme activity, etc.) was measured – This was a major advance in fish feed formulation and production
– Farmers no longer relied on wild fish to stock farms – Researchers developed techniques to spawn fish and rear tiny larvae
– Vaccines to prevent fish diseases – Development of specific genetic markers for disease resistance
– Complete elimination of marine resources in feeds – Determine dietary nutrient requirements for fish other than salmonids – Increased nutrient retention
– Been done in Japan and Australia – Combination of reproductive physiology and larval rearing
– Improved detection of pathogens in fish, esp. broodstock – Biosecurity, especially in recirculation systems
– Mostly Atlantic salmon (native to north Atlantic ocean) – Big producers are Norway, Chile, Scotland, Canada
– Primarily Pacific white shrimp and tiger shrimp – Thailand, Indonesia, Ecuador, Mexico supply US markets
– Several species – mainly Nile tilapia – China, Indonesia, Philippines, Thailand, Mexico, Costa Rico supply US market
and in stores in 48 hrs
– Farmed is 1.5x of global supply and 8x the supply of wild salmon for ‘white-tablecloth’ (not canned or smoked)
– Positive effects on CVD, neonatal development, other conditions
– Essentially zero mercury – Very low levels of PCBs and other persistent organic pollutants
500000 1000000 1500000 2000000 Wild Chinook Wild Coho Wild Sockeye Total Farmed
Million metric tons
– Need new sources of omega-3 fatty acids besides fish oil
– Chile production reduced ~90% by a virus (ISA) imported from Norway – New vaccine for ISA, plus new rules on fish transfers
– Metabolic and fecal wastes from farming that cause local impacts below pens
– Escapees that could colonize natural salmon streams and compete with native salmon stocks
– Litopenaeus vannamei (Pacific white shrimp – Pacific coast, Ecuador to Mexico) – smaller size (30-50 count) – Penaeus monodon (tiger shrimp – Asia) – larger size (7-12 count)
– Associated with poor water quality and overcrowding – Pacific shrimp are less susceptible than tiger shrimp
500000 1000000 1500000 2000000 2500000 1987 1988 1989 1990 1991 1992 1993 1994 1995 1996 1997 1998 1999 2000 2001 2002 2003 2004 2005 2006 2007
Metric tons
Switchover to Litopenaeus vannamai in Asia
– Higher feed inputs and intensive water quality management – Productivity increased from 300 kg/hectare to 12,000+ kg/hectare
– Able to rear shrimp broodstock to maturation with high reproductive performance – This allows genetic improvement and production of specific pathogen-free post-larvae for stocking – (natural progression – needed for many other species)
– Major food source in food-deficit and developing countries – Grown in tropical or semi-tropical areas (also in geothermal water in Idaho)
– Post-juveniles grow well on all-plant diet – So do fry but growers use fish meal–based diets
– Compares to 50% for salmon, trout or shrimp – Good potential to recover and utilize processing byproduct
50000 100000 150000 200000 250000 300000 350000 400000 1990 1992 1994 1996 1998 2000 2002 2004 2006
metric tons
– Tilapia tastes bland (not fishy) – No bones in fillets
– Disease resistant – Tolerate high water temperatures and low dissolved oxygen levels in water (can’t handle cold) – Grow at high densities
– Biochemistry/molecular biology/metabolomics/etc. – General fish biology/life history – Physiology/reproduction/endocrinology – Genetics and breeding – Fish diseases/microbiology/virology/parasitology
– Conservation or enhancement hatcheries – Commercial aquaculture – Aquarium trade, public aquariums
5 10 15 20 25 30 35 40 45 50 1995 1997 1999 2001 2003 2005 2007 2009 2011 2013 2015
Feed Production (mmt)
0.000 5.000 10.000 15.000 20.000 25.000 30.000 35.000 40.000 45.000 50.000 1995 1997 1999 2001 2003 2005 2007 2009 2011 2013 2015
– Use in poultry and swine feeds is about 32%
200 400 600 800 1000 1200 1400 1600 1800 Dec 02 Dec 03 Dec 04 Dec 05 Dec 06 Dec 07 Dec 08 Dec 09 Fishmeal Soymeal
– Increase offset improvements in lowering the percentages FM in feeds for various species
– use of feeds containing fish meal for carp, tilapia, etc.
– Especially for marine fish in Asia
10 20 30 40 50 60 70 1995 1997 1999 2001 2003 2005 2007
Percent FM in feeds Tonnes FM used (x104)
20 40 60 80 100 120 1995 1997 1999 2001 2003 2005 2007
Percent FM in feeds Tonnes FM used (x104)
10 20 30 40 50 60 70 1995 1997 1999 2001 2003 2005 2007
Percent FM in feeds Tonnes FM used (x104)
– Aquaculture production will continue to increase – So will fish feed production
– Not difficult to reduce FM levels by half – Lowering fish meal and fish oil levels further will require a deeper understanding
– Sometimes need animal protein (poultry byproduct meal, etc.) – Best plant protein concentrates are used in human foods - costly
– What other nutrients or biologically active compounds are in fish meal and missing from plant proteins? – Vice-versa with plant proteins
– Need to understand the dynamics and drivers of long-chain PUFA deposition in fish
– Plant ingredients have more fiber and non-soluble carbohydrates (NSPs) that are indigestible – Substituting plant proteins for FM alters tissue protein metabolism
– Cost of feed compared to value of products
– We only have estimates for salmonids, catfish, carp and shrimp – No clue on the other 190 species being farmed
– As levels of fish meal and oil are reduced, we lose essential amino acids, vitamins & minerals (especially phosphorus) – As levels of plant-derived proteins increase, we add fiber, non-soluble polysaccarides, anti-nutrients, phytate-phosphorus and create an imbalance of essential amino acids – This increases the environmental impacts of fish farming
– Amazing how little we know about intestinal transporters, nutrient signaling, energy allocation, drivers of muscle growth, etc.
– Determine how nutrients affect metabolic pathways, muscle growth, energy allocation, immune function, etc. – Use high-throughput data generation coupled with new computational software & data mining tools for pathway building and developing large biomolecular networks
– Develop strains of fish have improved performance when fed plant- based feeds – Use molecular tools to follow improvements and avoid co-selection for undesirable traits
– Developed over 6 years of experimentation – Growth of trout is equivalent to fishmeal-based feeds, but only with selected family lines from our breeding program – Sensory analysis shows no effect on fillet quality – Mercury is nearly undetectable; POPs lower than English muffin – Feed cost is in the ball-park, so feed cost per unit gain is close
– Higher loss of nitrogen to the environment
– Growth reduced and feed conversion ratio higher – However, this was not with selected strains of Atlantic salmon
(isoleucine) and corn gluten (leucine)
plant proteins are not
How can genomics help us understand the effects of these differences?
– carnitylpalmitate transferase – acetyl CoA dehydrogenase – PPARα, PPARβ. PPARγ – glucose-6-dehydrogenase, fructose 1,6-biphosphate, pyruvate carboxylase – TNFα (more immune-related but responding to nutritional input)
REDD1 stimulates TSC complex and blocks mTOR
– Important as we reduce fishmeal in feeds
– Diet – Alternate ingredient – Nutrient level for requirement studies
– Developed from medicine and pharmacology
– All are short latency, discrete conditions affecting a single tissue – Rickets/osteomalacia (vit D), beriberi (thiamin), pellegra (niacin)
– No reason why intake to prevent short-latency diseases prevents long- latency conditions
– Increased vitamin D intake associated with lower risk of diabetes, hypertension, various cancers, multiple sclerosis and periodontal disease, to name a few
– Vitamin D is classic example
– Based on responses of multiple tissues and organs – Could use gene expression but better to use pathway analysis from transcriptome data to discover new relationships and responses – Must couple with physiological and perfomance assessment
– Developing ‘phase-feeding’ protocols to lower total use of fish oils
– Evaluating trout lines to see if differences exist in fatty acid deposition rates and gene expression that could be used in selective breeding – Looking at effects of different dietary fatty acid ratios on metabolism and immune responses
18:3n-3 18:4n-3 18:2n-6 18:1n-9 20:4n-3 18:3n-6 20:3n-6 18:2n-9 20:2n-9 20:5n-3 22:5n-3 24:5n-3 20:4n-6 20:3n-9 22:6n-3 24:6n-3
From Fish Nutrition, Ed 3
linolenic acid linoleic acid
Docosohexaenoic acid (DHA) Eicosapentaenoic- acid (EPA)
Delta 6 Desaturase
10 20 30 40 50 60 70 CX99 CX98 CX51 CX53 CX84 CX80 CX78 CX82 CX55 CX72 CX71 CX75 CX92 CX97 CX77 Family Relative Expression
Canola oil diet
Delta 6 Desaturase
5 10 15 20 25 30 CX55 CX53 CX51 CX99 CX84 CX72 CX78 CX71 CX98 CX75 CX80 CX77 CX92 CX97 CX82 Family Relative Expression
Fish oil diet
Delta 5 Desaturase
5 10 15 20 25 CX-71 CX-51 CX-53 CX-99 CX-55 CX-75 CX-98 CX-80 CX-97 CX-72 CX-92 CX-82 CX-77 CX-84 CX-78 Family Relative Expression
Canola oil diet
Delta 5 Desaturase
2 4 6 8 10 12 14 CX-99 CX-51 CX-97 CX-53 CX-55 CX-77 CX-75 CX-92 CX-98 CX-71 CX-72 CX-80 CX-84 CX-78 CX-82 Famiily Relative Expression
Fish oil diet
50 100 150 200 250
Aquaculture Catch for food Fish meal Million metric tons
– Lifetime of undergraduates in the audience – Aquaculture production increased 10x
– Just to keep up with population growth and per capita intake will require production to more than double – Feed production will also have to double – Freshwater production – cannot double freshwater resources but maybe increase productivity of existing freshwater systems – Marine and offshore aquaculture? Cost and environmental issues – Recirculation systems? Cost and efficiency
– 80mt/hectare/yr of duckweed – Native species everywhere – No competition with food or crop production – Little water consumption – Protein concentrate is 65% protein and 86% digestible to fish
– Physiology – Genetics and molecular biology – Nutrition and biochemisty – Diseases and immunology
– Values (personal, cultural) are crucial elements of our decisions – Our cultural values are not always important to other cultures – Our science is, however, persuasive
0.00 0.20 0.40 0.60 0.80 1.00 1.20 1995 1997 1999 2001 2003 2005 2007 FI:FO Year
Fish-In to Fish-Out Ratios for Fed Species
0.00 0.20 0.40 0.60 0.80 1.00 1.20 1.40 1.60 1.80 1995 1997 1999 2001 2003 2005 2007 FI:FO Year
Fish-In to Fish-Out Ratios for Fed Species
2 2.5 3 3.5 4 4.5 5 5.5 6 6.5
0% 10% 20% 30% 40% 50%
% Fish Oil Inclusion Fish I:Fish Out Ratio % Fishmeal Inclusion FM Inclusion where FCR 1.3 and FO 16% FO Inclusion where FCR 1.3 and FM 24% b
Marine landings (food only) 53.9 Freshwater landings 10.1
Marine aquaculture 23.1 Freshwater aquaculture 27.9
Wild harvest marine plants 1.8 Aquaculture marine plants 15.7
Species Metric tons production Channel catfish 276,364 Rainbow trout 27,561 Crawfish 16,788 Atlantic salmon 9,420 Tilapia 7,820 Hybrid striped bass 500 Yellow perch 50
1 2 3 4 5 6 7 8 9 10
Salmon Trout Shrimp Chicken Swine Wild fish
Feed conversion ratio (feed fed/live weight gain)
10 20 30 40 50
Protein retention (% of dietary protein used for growth)