
SLIDE 1
New York Pizza
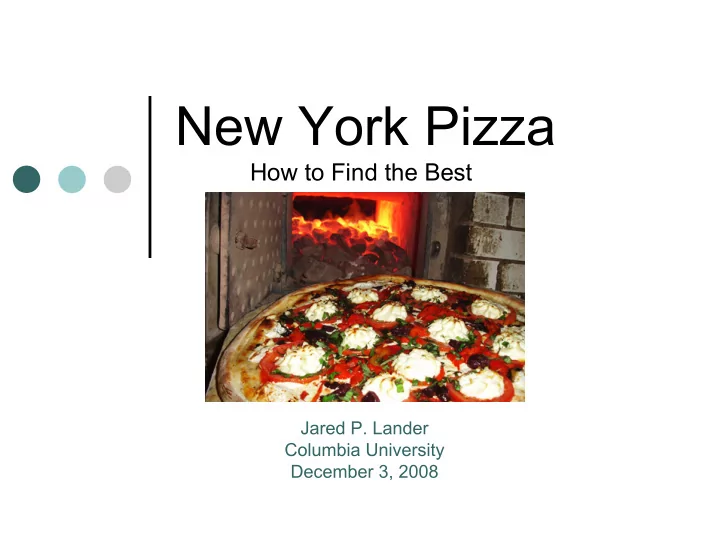
How to Find the Best Jared P. Lander Columbia University December 3, 2008
New York Pizza How to Find the Best Jared P. Lander Columbia - - PowerPoint PPT Presentation
New York Pizza How to Find the Best Jared P. Lander Columbia University December 3, 2008 What is New York Style? What is New York Style? Charring and air bubbles around the crust What is New York Style? Thin Slices Charring and air
How to Find the Best Jared P. Lander Columbia University December 3, 2008
Charring and air bubbles around the crust
Charring and air bubbles around the crust Thin Slices
Charring and air bubbles around the crust Thin Slices Just the right bend for folding
Lombardi’s (1905)
Lombardi’s (1905) Totonno’s (1924)
Lombardi’s (1905) Totonno’s (1924) John’s of Bleecker (1929)
Lombardi’s (1905) Totonno’s (1924) Patsy’s (1933) John’s of Bleecker (1929)
Lombardi’s (1905) Totonno’s (1924) Patsy’s (1933) John’s of Bleecker (1929) Grimaldi’s (1990)
nearly 700 restaurants tagged as pizza in Manhattan and parts of Brooklyn
Df F Pr(>F)
2.8195 0.03826 *
minimal impact of the lone coefficient in the model
.020 .005 .006 One Sided P-Value
Use the number of reviews as a proxy for popularity Why do people frequent these pizzerias in the first place?
Approximately Poisson
1.641*FuelGas – 0.734*FuelWood - 0.545*PriceExpensive + 0.119*FuelGas:PriceExpensive + 0.670*FuelWood:PriceExpensive
3.82693 0.05899 64.876 < 2e-16 ***
1.641*FuelGas – 0.734*FuelWood - 0.545*PriceExpensive + 0.119*FuelGas:PriceExpensive + 0.670*FuelWood:PriceExpensive
Price * Fuel
Coal and then wood dominates! All pizzerias on this list are categorized as expensive Both Uptown and Downtown
Island)
Harlem)
Suprema
Napoletana
Slice Serious Eats Midtown Lunch Revolution Computing NBC New York
Pie: Margherita: Neapolitan: Upscale: Largest: John’s of Bleecker Pizza 33 Joe’s (Carmine St.) Kesté Koronet Specialty: Specialty: Grandma: Upside Down: Cheapest: Artichoke Vinny Vincenz Maffei’s New York Pizza Suprema Crocodile Lounge*
* Free with purchase of beer