
SLIDE 1
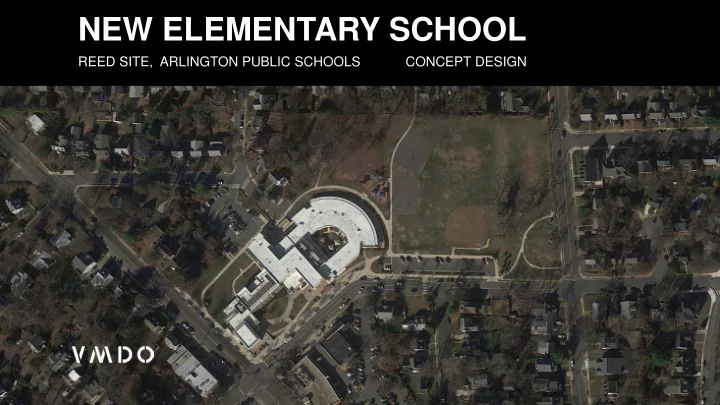
NEW ELEMENTARY SCHOOL
REED SITE, ARLINGTON PUBLIC SCHOOLS CONCEPT DESIGN
NEW ELEMENTARY SCHOOL REED SITE, ARLINGTON PUBLIC SCHOOLS - - PowerPoint PPT Presentation
NEW ELEMENTARY SCHOOL REED SITE, ARLINGTON PUBLIC SCHOOLS CONCEPT DESIGN BLPC + PFRC JOINT MEETING BUILDING LEVEL PLANNING COMMITTEE PUBLIC FACILITIES REVIEW COMMITTEE 1. Welcome / Opening remarks 2. Updates 3. County Update
REED SITE, ARLINGTON PUBLIC SCHOOLS CONCEPT DESIGN
April 4, 2018 BUILDING LEVEL PLANNING COMMITTEE PUBLIC FACILITIES REVIEW COMMITTEE
1. Welcome / Opening remarks 2. Updates 3. County Update 4. Transportation and Parking
5. BLPC/PFRC Discussion 6. Public Comments 7. Next Steps & Adjourn
04.04.2018 BLPC + PFRC
3
12.13.2017 BLPC + PFRC
4
04.04.2018 PRFC + BLPC
4
2. Support APS Strategic Plan Goals, specifically Goal #4 – Provide Optimal Learning Environments 3. Address capacity by providing at least 725 seats 4. Open by start of school 2021 5. Spend a maximum project cost $49 million, with options for less
CORE MISSION
12.13.2017 BLPC + PFRC
5
04.04.2018 PRFC + BLPC
5
BIDDING
OVERALL PROJECT TIMELINE
Mar 2018
Concept Design SB Approval
CONCEPT DESIGN SCHEMATIC DESIGN DESIGN DEVELOPMENT
July 2018
Schematic Design SB Approval
Nov 2018
Design Development Submission
Jun 2019
Final Design SB Approval
CONSTRUCTION DOCUMENTATION
Sep 2021
School Opens
CONSTRUCTION Building Permit Approval Use Permit Approval NOV 2018 MAY 2019
Mar 2019
Construction Document Submission
04.04.2018 BLPC + PFRC
6
04.04.2018 BLPC + PFRC
8
04.04.2018 BLPC + PFRC
9
12.13.2017 BLPC + PFRC
10
04.04.2018 PRFC + BLPC
10
Overall Schedule March 22nd Information Item to School Board April 5th Action Item to School Board April through June Schematic Design OVERVIEW
Transportation Schedule January 24th Finalized Scoping Agreement February 8th Traffic Data Collection February 21st BLPC/PFRC Transportation Meeting April 4th BLPC/PFRC Transportation Meeting Early May Draft Transportation Report Released May & June Transportation Report Comments and Revisions After Schematic Design TDM, Parking and Arrival/Dismissal Plans
12.13.2017 BLPC + PFRC
11
04.04.2018 PRFC + BLPC
11
MEETING 1: 02-21-2018 APS Go! Survey data What is it telling us? Pedestrian access and walking routes How can we improve and expand the walk zone? Parking demand Estimates and thoughts on supply needs Parent drop-off and pick-up Estimates and thoughts on accommodations and
OVERVIEW
MEETING 2: 04-04-2018 Vehicular traffic to/from school How much and when? Traffic capacity at nearby intersections Implications on school access School buses Initial thoughts on routing and maneuvering Potential Improvements Roadway geometry & operations Responses to comments from Meeting #1
12.13.2017 BLPC + PFRC
12
04.04.2018 PRFC + BLPC
12
Goal: Recommend ways that a new 725 seat ES can have an efficient and safe transportation network, and minimize impacts to the surrounding street network and neighborhood. Transportation Planning Principles Spread out transportation demand
Minimize conflicts between
Minimize impact of site traffic on adjacent street traffic OVERVIEW
Definitions: Vehicular Trip – a car traveling to or from the site Teacher parking = one trip Parent dropping off student = two trips Peak Traffic – a distinct time frame where traffic levels are higher than average (e.g. AM and PM commuter peak) Site peak = peak traffic from Reed site Adjacent street peak = traffic within study area in general Volume – number of cars over a certain timeframe Capacity – maximum volume that can be accommodated in system
04.04.2018 BLPC + PFRC
13
12.13.2017 BLPC + PFRC
14
04.04.2018 PRFC + BLPC
14
times of 9am to 3:41pm
closest school to the site has bell times of 7:50am to 2:24pm
for the new ES at Reed is bell times of 9am to 3:41pm TRAFFIC
12.13.2017 BLPC + PFRC
15
04.04.2018 PRFC + BLPC
15
and out of the Reed site
the Northwest and 18th Street parking lots
TRAFFIC
12.13.2017 BLPC + PFRC
16
04.04.2018 PRFC + BLPC
16
doesn’t generate a lot of traffic to/from and site
patrons parking on-street
TRAFFIC
12.13.2017 BLPC + PFRC
17
04.04.2018 PRFC + BLPC
17
based on data from similar APS schools
from the school will be from parents dropping-
students
significant but short
than afternoon due to after-school activities and after care programs
impacts from Schools are usually from this type of traffic
TRAFFIC
12.13.2017 BLPC + PFRC
18
04.04.2018 PRFC + BLPC
18
significant than drop-off & pick-up trips
before and depart after parent traffic peaks
compared to other sources
TRAFFIC
12.13.2017 BLPC + PFRC
19
04.04.2018 PRFC + BLPC
19
Blvd is pretty level between 7:30 and 9:00 AM
time
be noticeable during this time
Washington Blvd is 4:45 to 6:00 pm
avoid this peak
peak but will likely not increase it
TRAFFIC
Washington Blvd Traffic
12.13.2017 BLPC + PFRC
20
04.04.2018 PRFC + BLPC
20
how traffic arrives and departs the site
different traffic patterns, and thus different access needs
access should be located
hierarchy, avoiding residential streets
be located on a ‘quieter’ street, as it is less intense and contains regular drivers ROUTING
12.13.2017 BLPC + PFRC
21
04.04.2018 PRFC + BLPC
21
frontages, McKinley/18th, Lexington, Washington, and 18th Street behind the library
18th St avoids residential streets more than access behind library
be accessed where NW lot is today (without mitigation)
would be acceptable, though not as preferred as 18th/McKinley
is less desirable ROUTING
Routes to 18th Street near NW Lot Routes to McKinley Rd/18th Street
04.04.2018 BLPC + PFRC
22
12.13.2017 BLPC + PFRC
23
04.04.2018 PRFC + BLPC
23
morning, afternoon, and evening peak periods
using counts of peak periods
standards (a single Tuesday, Wednesday or Thursday, when schools are in session)
the highest amount of traffic in the study area
TRAFFIC CAPACITY
1,000 veh/day 5,000 veh/day 10,000 veh/day 15,000 veh/day
12.13.2017 BLPC + PFRC
24
04.04.2018 PRFC + BLPC
24
Capacity ratio at each study intersection
intersections have room to accommodate more traffic
tend to use routes that have available capacity TRAFFIC CAPACITY
Highest volume to capacity ratio at intersection
0.31 x.xx 0.82 0.09 0.19 0.09 0.01 0.05 0.04 0.02
12.13.2017 BLPC + PFRC
25
04.04.2018 PRFC + BLPC
25
more detailed metrics than volume to capacity
used are delay/car due to intersection control and queuing
issues of concern (1) southbound traffic on 18th trying to turn onto westbound Washington Blvd, and (2) queuing going westbound on Washington Blvd from traffic signal at McKinley TRAFFIC CAPACITY
#1 #2
12.13.2017 BLPC + PFRC
26
04.04.2018 PRFC + BLPC
26
conditions in the study area matched traffic models, except that the traffic signal at Washington Blvd & McKinley Road looks better than the traffic models
difficulty with ‘grey’ areas (e.g. cars going around cars waiting to turn left, ambiguously marked asphalt, etc…)
when interpreting the numbers TRAFFIC CAPACITY
12.13.2017 BLPC + PFRC
27
04.04.2018 PRFC + BLPC
27
peak
had similar findings as AM also TRAFFIC CAPACITY
Highest volume to capacity ratio at intersection
0.14 x.xx 0.73 0.07 0.15 0.06 0.01 0.06 0.04 0.01
04.04.2018 BLPC + PFRC
28
12.13.2017 BLPC + PFRC
29
04.04.2018 PRFC + BLPC
29
how much room to buses need, and where’s the best place to put them on site?
best way to approach the site?
adjacent streets are best suited to handle bus traffic? BUSES
12.13.2017 BLPC + PFRC
30
04.04.2018 PRFC + BLPC
30
BUSES
A bus turn-around takes up substantial room May be viable as part of a parking lot, but given space constrains on site, a curbside solution may be best
12.13.2017 BLPC + PFRC
31
04.04.2018 PRFC + BLPC
31
BUSES
Seven (7) school buses can fit on western blockface of Lexington Street Addition of “No Parking” signs during certain hours would be needed Adequate street width to accommodate school buses exists Could require wider sidewalks to facilitate loading/unloading Long walk to the school site
12.13.2017 BLPC + PFRC
32
04.04.2018 PRFC + BLPC
32
BUSES
Seven (7) school buses can fit on northern blockface of 18th Street Addition of “No Parking” signs during certain hours would be needed Adequate street width to accommodate school buses exists Could require wider sidewalks to facilitate loading/unloading Possible issue with of the crosswalk at 18th Street and Longfellow
12.13.2017 BLPC + PFRC
33
04.04.2018 PRFC + BLPC
33
BUSES
Seven (7) school buses can fit on northern blockface of McKinley Road Currently accommodates buses at curbside Adequate street width to accommodate school buses exists Has wide sidewalks to facilitate loading/unloading Issue with curve in roadway
12.13.2017 BLPC + PFRC
34
04.04.2018 PRFC + BLPC
34
narrow for buses
similar cross-sections, with adequate room to accommodate buses at the curb STREET CROSS SECTIONS
0' 10' 20' 30' 40' 50' 60'
Cross Section A
(18th Street N)
Sid idewalk lk + + land ndscap aping ng
9'
WB/EB EB
7'
Cross Section B
(McKinley Road)
WB
8' 10'
EB EB
70'
22'
Sid idewalk lk + + land ndscap aping ng
10'
Sid idewalk lk + + land ndscap aping ng
8' 8'
Par arking ng Par arking ng Par arking ng Par arking ng
Cross Section C
(18th Street N)
WB
8' 10'
EB EB
14'
Sid idewalk lk + + land ndscap aping ng
10' 7'
Par arking ng Par arking ng
Cross Section D
(N Lexington Street)
8'
Sid idewalk lk + + land ndscap aping ng WB
8' 10'
EB EB
10'
Sid idewalk lk + + land ndscap aping ng
8' 8'
Par arking ng Par arking ng N S N S N S W E
0' 10' 20' 30' 40' 50' 60' 70'
A B C D
12.13.2017 BLPC + PFRC
35
04.04.2018 PRFC + BLPC
35
STREET CROSS SECTIONS
Lane restriping on McKinley likely needed in any scenario Detailed recommendation to mitigate this will be included in traffic study Tight spacing for two cars passing each other Buses cannot make it through without encroaching
04.04.2018 BLPC + PFRC
36
12.13.2017 BLPC + PFRC
37
04.04.2018 PRFC + BLPC
37
SUMMARY
Current location of NW parking lot – only good for staff parking (without mitigation) 18th Street lot – good location for additional parking, parent drop-
Probably best to accommodate buses at the curb Traffic will likely approach from Patrick Henry side, avoiding Washington Blvd Significant capacity exists
accommodate school traffic
04.04.2018 BLPC + PFRC
38
12.13.2017 BLPC + PFRC
39
04.04.2018 PRFC + BLPC
39 161 Survey responses and several detailed emails (THANKS!). Meeting on March 19th to review comments. Concerns: Crossing with 18th Street and:
Missing sidewalks
sidewalks in PUs 15010, 15020, 16090 (on western area of potential Walk Zone)
UPDATES FROM MEETING #1
12.13.2017 BLPC + PFRC
40
04.04.2018 PRFC + BLPC
40
UPDATES FROM MEETING #1
Original Preliminary Walk Zones Revised Preliminary Walk Zones
Preliminary Walk Zone Expandable Walk Zone Collaborative Walk Zone (PUs with general agreement) Walk Zones for Further Evaluation (for splitting PU)
12.13.2017 BLPC + PFRC
41
04.04.2018 PRFC + BLPC
41
Additional parking counts are planned Waiting for after Spring Break and good weather Plan to cover ‘Story-time’ at the Library Will revise/update parking demand estimates with the new data UPDATES FROM MEETING #1
12.13.2017 BLPC + PFRC
42
04.04.2018 PRFC + BLPC
42
UPDATES FROM MEETING #1
Updated thoughts on
(1) Accommodate buses further away from retail/library to free up on- street parking 1
12.13.2017 BLPC + PFRC
43
04.04.2018 PRFC + BLPC
43
UPDATES FROM MEETING #1
Updated thoughts on
(1) Accommodate buses further away from retail/library to free up on- street parking (2) Use time limits on on- street parking close to library/retail 1 2
Currently unrestricted parking
12.13.2017 BLPC + PFRC
44
04.04.2018 PRFC + BLPC
44
UPDATES FROM MEETING #1
Updated thoughts on
(1) Accommodate buses further away from retail/library to free up on- street parking (2) Use time limits on on- street parking close to library/retail (3) Take advantage of on- street parking available nearby for overflow staff parking (4) Sign on-site parking supply so it can accommodate ES visitors and library patrons 1 2 3
85% of the homes on these blocks have driveways
04.04.2018 BLPC + PFRC
45
12.13.2017 BLPC + PFRC
46
04.04.2018 PRFC + BLPC
46
COMBINED TRANSPORTATION & PARKING STRATEGY
First take at compiling all
per topic onto the recommended plan All numbers and ideas presented tonight are first
back and forth with the design team a few more times before finalizing designs (including final numbers).
12.13.2017 BLPC + PFRC
47
04.04.2018 PRFC + BLPC
47
COMBINED TRANSPORTATION & PARKING STRATEGY
Make room for queuing in the expanded 18th Street lot. Convert the lot to a one- way loop and remove one
provide more curbside spaces and fewer pedestrian conflict points. Queuing for 30 cars in a flexible configuration Remove driveway (provides more curbside space) Visitor parking in queueing area off-peak
12.13.2017 BLPC + PFRC
48
04.04.2018 PRFC + BLPC
48
COMBINED TRANSPORTATION & PARKING STRATEGY
Place bus queuing on 18th, but further away from Washington Blvd Explore altering curb to provide more maneuvering room for buses. Widen sidewalks to accommodate bus passenger queuing/movement
12.13.2017 BLPC + PFRC
49
04.04.2018 PRFC + BLPC
49
COMBINED TRANSPORTATION & PARKING STRATEGY
Dedicate some parking in expanded NW lot to library staff/volunteers Dedicate some library visitor/patron parking in the expanded 18th St lot Some library visitor/patron parking expected to take place on-street in front of the library 15 spaces marked for library staff/volunteer only 18 spaces for library visitor parking Total library parking demand of 43 cars 33 parking in lots 10 parked on-street Do not pursue access on Washington
would rather have the parking spaces and fewer pedestrian/vehicle conflicts
12.13.2017 BLPC + PFRC
50
04.04.2018 PRFC + BLPC
50
COMBINED TRANSPORTATION & PARKING STRATEGY
Park ES staff in expanded NW lot and expanded 18th Street lot Some use of on-street parking, occurring further away from Washington Blvd Visitor parking in expanded 18th St lot, including time restricted visitor spaces in the queuing area (minimum of 10 spaces) New ES school On-Site: 100 On-Street: 19 Total: 119 Library On-Site: 33 On-Street: 10 Total: 43 Total On-Site: 133 On-Street: 29 Total 162
04.04.2018 BLPC + PFRC
51
04.04.2018 BLPC + PFRC
52
04.04.2018 BLPC + PFRC
53
12.13.2017 BLPC + PFRC
54
04.04.2018 PRFC + BLPC
54
NEXT STEPS
analysis
12.13.2017 BLPC + PFRC
55
04.04.2018 PRFC + BLPC
55
ADJORN
APS Project Manager Ajibola (Aji) Robinson PMP 703-228-7738 ajibola.robinson@apsva.us County Project Manager Nicole Boling 703-228-3945 nboling@arlingtonva.us
APS project website: https://www.apsva.us/design-and-construction/new- elementary-school-at-reed-building/
https://commissions.arlingtonva.us/planning-commission/public-facilities-review- committee-pfrc/school-projects/walter-reed/