
SLIDE 1
Clairborne Pell Elementary School Budget Presentation 12/15/2015 1
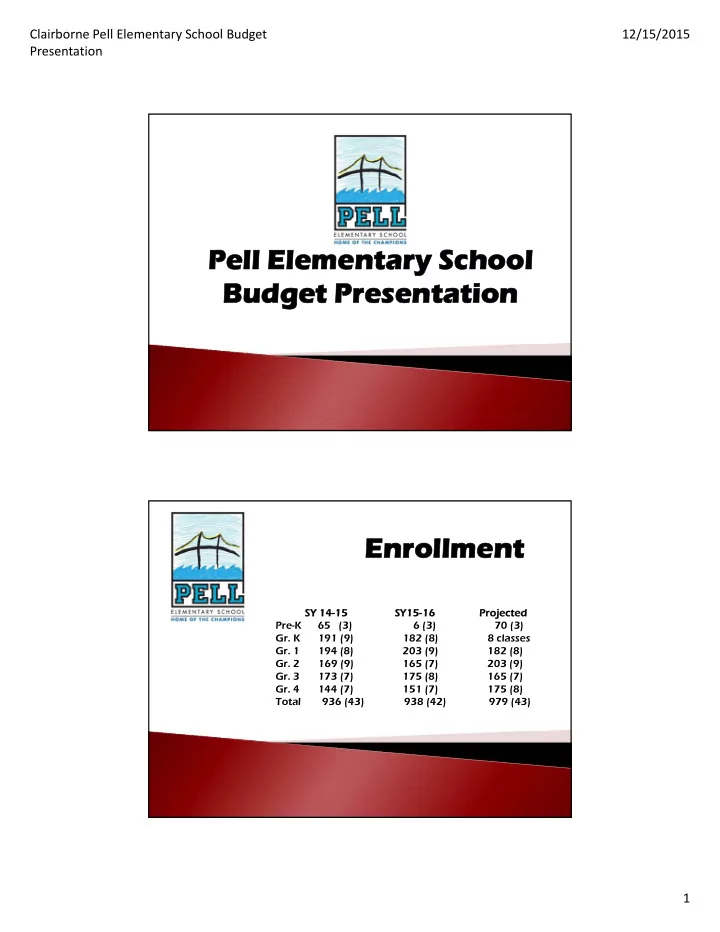
Pell Elementary School Pell Elementary School Budget Presentation Budget Presentation Enrollment Enrollment
SY 14- SY 14-15 15 SY15- SY15-16 16 Pro Projec ected ted Pre-K 65 (3) 6 (3) 70 (3)
- Gr. K
191 (9) 182 (8) 8 classes
- Gr. 1
194 (8) 203 (9) 182 (8)
- Gr. 2 169 (9)
165 (7) 203 (9)
- Gr. 3
173 (7) 175 (8) 165 (7)
- Gr. 4
144 (7) 151 (7) 175 (8) Total 936 (43) 938 (42) 979 (43)