
SLIDE 1
Net Metering
1
Net Metering Green Mountain Power 1 Net Metering The Beginning - - PowerPoint PPT Presentation
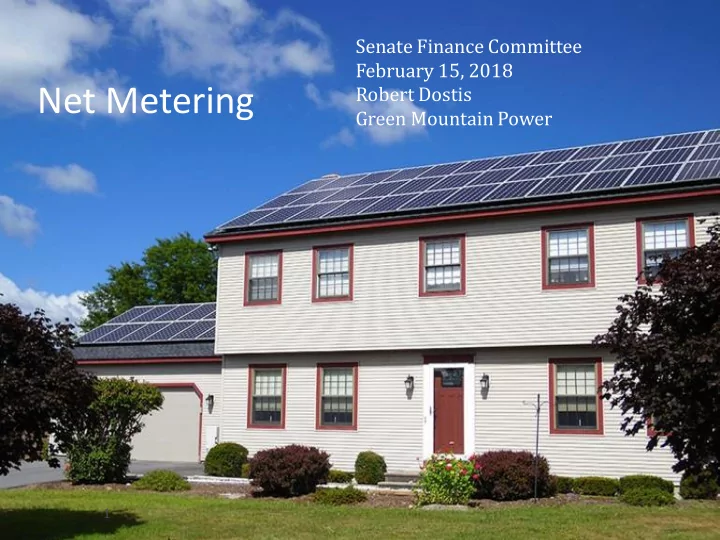
Senate Finance Committee February 15, 2018 Robert Dostis Net Metering Green Mountain Power 1 Net Metering The Beginning Allowed customers to produce their own renewable electricity, generally rooftop Power produced went directly
1
Allowed customers to produce their own renewable
Power produced went directly into the home or business Excess electricity was sent to the electric grid and
If electricity produced was greater than what was used in
If customer used more electricity
2
3
1,300% increase since 2013 Growth under NM 2.0 remains robust with 32.2
More than half of the capacity are 500 kw systems that
Merchant generators receive the net meter rate, but Unlike traditional net metering (roof top/back yard):
They send power directly to the grid rather than to a home
They sell power to customers through PPA or contract They serve primarily commercial customers
* GMP is presently at 183.8 MW of net metering; 178 is solar and = 26% of Peak Load; All Solar = 45% of peak load (Net metering 178 MW; and PPA; Standard Offer; GMP owned = 140.8)
Net metering:
Required all utilities to offer a solar adder setting total value at
GMP in 2008 started with 6 cent “solar adder” equal to the value
Increased capacity of generators to 500 kW. (= 4 acres dev.) Increased the cumulative net metering cap to 4%, or 28 MW
Allowed net metering credits to be monetized, thus the kWh
Guaranteed incentive for ten years from installation.
5
Increased cap from 4%to 15%
Allowed 5 MW solar on a closed landfills (Cost – see chart - total built 11 MW)
Charged PUC to design program to balance pace of deployment with cost shift starting 1/1/2017
Project (12/4/17) Size (kW) Status Vermont Air National Guard (S Burlington) 2,100 Active National Guard Westminster 1,793 Active Brattleboro Landfill 4,980 In Construction South Burlington Landfill 1,764 Active
2,502 4,137 6,094 7,392 19,431 8,159 2,840 4,971 6,698 10,146 6,953 6,076 1,575 3,276 7,860 48,176 14,299 2,100 500 8,544
20,000 30,000 40,000 50,000 60,000 2012 2013 2014 2015 2016 2017
Accepted Net Metering in kilowatts / Year
<= 15 kW > 15 kW, <= 150 kW > 150 kW, <= 500 kW Landfill/Military
6 Notice the robust growth in small net- metered systems.
500 kw systems represent 47% (69.2 MW) of capacity and 2% of the application 150 kw systems represent 23% (33.1 MW) of capacity and 5% of the application 15 kw systems represent 30% (43.5 MW) of capacity and 93% of the application
500 kw systems represent 52% (16.6 MW) of capacity and 2% of applications 150 kw systems represent 20% (6.6 MW) of capacity and 6% of applications 15 kw systems represent 28% (9.0 MW) of capacity and 92% of applications
9 Act 99 Resulted in Board Rule 5.100 – Effective 7/1/2017 PUC charged to support program growth while minimizing cost shift No impact to projects that received CPG prior to January 1, 2017 Limit Cost Shift Incentive levels were slightly reduced Siting: PUC identified “preferred sites,” such as brownfields. 150 kw
systems get less if not on a preferred site. 500 kw can only be on preferred site.
Starting in 2017 all new net metering projects are required to pay the
customer service charge, energy efficiency charge, energy assistance program charge, any on-bill financing and equipment rental charges
The total capacity of a single customer or group’s net metering systems may
not exceed 500 kW
NM 2.0 1,502 applications for 32.2 MW = ~ 4.6% of peak capacity
12
Incredible success story Important for our distributed energy future Cost-effective development is essential
13
453 Project >15 kw: 250 only Commercial, 182 both, 19 only residential