natural catastrophes
play

Natural Catastrophes: Is this the New Norm and other often asked - PDF document

27/04/2012 Natural Catastrophes: Is this the New Norm and other often asked Questions and inadequate reinsurance Sean Devlin 2 CAS Spring Meeting May 23, 2012 First a quick Look back at 201 1 Question 1 February March April January


  1. 27/04/2012 Natural Catastrophes: Is this the New Norm and other often asked Questions and inadequate reinsurance Sean Devlin 2 CAS Spring Meeting May 23, 2012 First a quick Look back at 201 1 Question 1 February March April January Japan Tohoku earthquake Record floods swamp Australia’s Cyclone Yasi, one of the largest and tsunami east coast, killing 35 people, and most powerful storms ever Buildings Impacted Series of tornadoes batter U.S. shutting coal mines, wiping out to hit Australia, devastating Coastal Southeast, killing an estimated roads, rail lines and thousands of sugar and banana crops. Municipalities 470486 364 people. One Tornado homes and costing more than $2 – Massive winter storm hits Non-Coastal spans 81 miles. billion in insured losses. U.S. causing travel chaos and Municipalities 438013 Record snowfall in USA power outages . TOTAL 908499 May June July August Tornado hits Joplin MO, killing Floods in China’s central and Worst drought in decades Hurricane Irene kills at least about 160 people, the single southern provinces kill more in Horn of Africa causes 40 people in the eastern deadliest U.S. twister since than 100 people. More than starvation. United States and triggers 1947 half a million are evacuated Flooding in Thailand the worst flooding in begins. decades in some states. September October November December Hurricane $ 4.3 Bn Thailand flood kills more Worst flooding along the Tropical Storm $ .5Bn Unusual October than 600, damage of at least Mekong River since 2000. Wildfire $ .5Bn Snowstorm leaves billions $42 billion disrupting auto Meanwhile Texas Tornado/Wind $26Bn without power and insured and electronics global supply experiences record breaking Winter Storm $ 2Bn losses reach $600 Million . chains wildfires 4 Your thoughts on what we have experienced the past few years, is it the new norm?
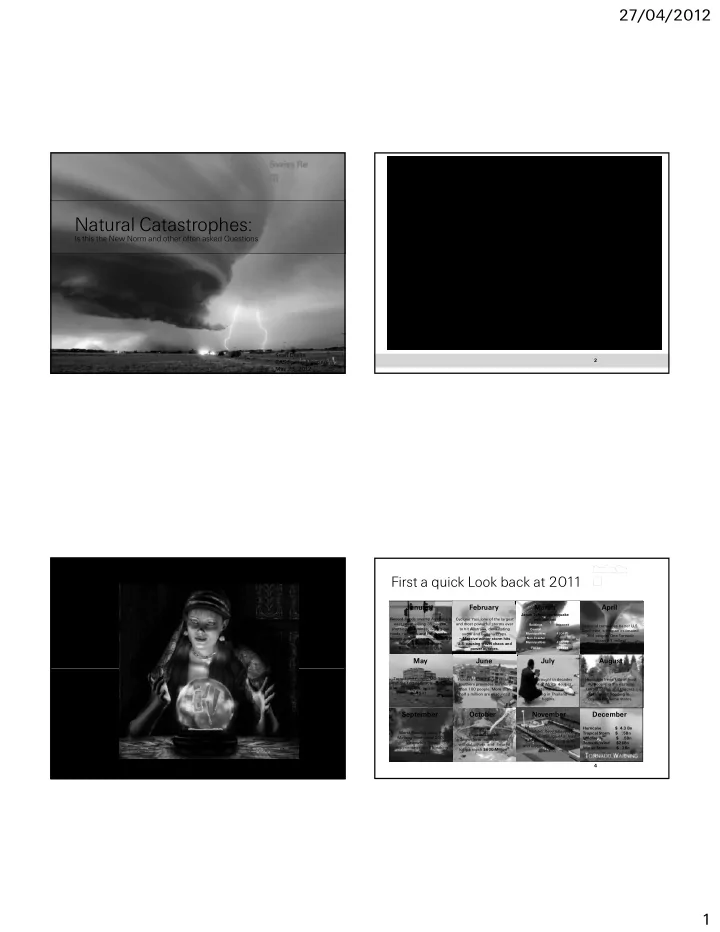
 1

  2. 27/04/2012 Before we think about the "New Norm", Industry Results what is normal anyway?  How do we judge what is or isn't HO/FO Schedule P L+LAE Ratios normal? 100.0% – Recent memory 95.0% short memory with long faces 90.0% – Selective memory 85.0% Direct name the last 5 Super Bowl losers 80.0% Net – Historical data and statistics 75.0% is there any bias 70.0% 65.0% – Trends or Normal Variation 60.0% objectivity…are all things considered? 55.0% – Cat model opinions 50.0% when have they ever been right? 2002 2004 2006 2008 2010 – Perceptions (ours or others [media]) perceptions become our reality Hurricane spikes in '04, '05, '08 – concentrate on Net Upward trend driven by storms, economic factors Net worse than direct – not much cat protection 5 6 My opinion points to the "Real Culprits" When did we start to ask what is normal? – Population, Wealth and Technology Insured catastrophe losses 1970-2010 Hurricane Katrina et al Hurricanes Ivan, Charley et al in USD bn, indexed to 2010 140 120 Gustav othar 100 ge Northrid Winter storm Lo Hurricane Ike, Attack on WTC Hurricane Andrew 80 60 40 Technology 20 Then and Now 0 1970 1975 1980 1985 1990 1995 2000 2005 Earthquake/tsunami Man-made disasters Weather-related Nat Cats Total 7 8 2

  3. 27/04/2012 Joplin, lets get a perspective for what a Question 2 tornado can do Are we seeing more Tornados and Tornado Losses than ever before? Records and Near Records Some Records 758 most ever in single month 542 previous record 2003 162 deaths highest since 1947 3 rd most active year since 1990 3 rd t ti i 1990 Large continuous length 80m Longest Continuous 1925, 234m 128 most ever recorded in AL 94 was prior record in 2009 7 Miles 12 21 Miles overall 3

  4. 27/04/2012 Where are the US Cat Losses Coming From anything unusual? Tornadoes: Where do they occur? PCS Losses 1950-2011 PCS Losses 2000-2011 Earthquake 0.01% 3.87% 5.56% Fire - Other 5.65% 7.79% 7.64% Hurricane Riot 40.16% Tropical Storm 40.14% 42.72% 39.08% Utilit S Utility Service Disruption i Di ti Volcanic Eruption Water Damage Wildland Fire Wind and Thunderstorm Event 0.27% 1.80% 1.67% 2.00% Winter Storm 1.28% 0.08% Workers Compensation 0.01% 0.05% But the averaged annual losses have increased by over 200% 13 14 Non Hurricane PCS Wind Losses, unusual but is it outside of the expected? Let's Try Again with Less Noise 40 35 Billions 40 25 35 30 Billions 35 30 25 20 30 50% of loss from Joplin/AL events 25 20 25 15 20 15 15 20 20 15 10 10 15 10 10 5 5 5 5 ‐ ‐ 1971 1973 1975 1977 1979 1981 1983 1985 1987 1989 1991 1993 1995 1997 1999 2001 2003 2005 2007 2009 2011 1971 1973 1975 1977 1979 1981 1983 1985 1987 1989 1991 1993 1995 1997 1999 2001 2003 2005 2007 2009 2011 ‐ ‐ 1991 1992 1993 1994 1995 1996 1997 1998 1999 2000 2001 2002 2003 2004 2005 2006 2007 2008 2009 2010 2011 1991 1992 1993 1994 1995 1996 1997 1998 1999 2000 2001 2002 2003 2004 2005 2006 2007 2008 2009 2010 2011  SCS = severe convective storm = straight line winds, thunderstorms, tornado, hail, etc.  Removing uncertain years prior to 1990  Adjusted Threshold to make counts and loss $ consistent over time  Adjusted Losses Capped at $3B per event  Volume and trend adjustments make 1990 and prior uncertain  What happened from 1999-2005? Weather seemed like, losses lighter  Industry coding may be more suspect, but 1970s and 1980 quiet per PCS and ISO Excess Wind data 15 16 4

  5. 27/04/2012 Are weather events more common? Why are losses up in recent years? # of Severe Events vs Adj Losses # of TO Events vs Adj Loss Avg Loss Per Event Type 35 40,000 35 2,000 Billions Billions 30 35,000 30 18 3,000 30,000 1,500 25 25 Millions Thousands 16 25,000 2,500 20 20 14 20,000 1,000 15 15 12 2,000 15,000 10 10 10 10,000 500 1,500 8 5 5,000 5 6 6 1,000 1,000 ‐ ‐ ‐ ‐ ‐ ‐ ‐ ‐ 2000 2002 2004 2006 2008 2010 2000 2002 2004 2006 2008 2010 4 500 2 Adj Loss # Of Events Adj Loss Tornado ‐ ‐ 2000 2002 2004 2006 2008 2010 TO Wind/Hail  Severe events of Tornado, Wind and Hail captured by NOAA/SPC  Adjusted SCS/Winter PCS losses/per SPC event regardless where losses came from  Hitting more populated location?  Little correlation of either # of events to Industry losses  Economic driven? 17 18 Tornado Historical Record 2000 160 Why are losses up in recent years? 140 120 1800 100 80 1600 60 40 3 Year MA PCS vs Unemployment Rate 1400 20 0 1283 20 10.0% YEAR 1957 1960 1963 1966 1969 1972 1975 1978 1981 1984 1987 1990 1993 1996 1999 2002 2005 2008 Billions 1200 8.0% 3 4 5 15 1000 6.0% 10 4.0% 800 5 2.0% 600 ‐ 0.0% 400 3 Yr MA PCS UE 3 Yr MA 200 0 UKN 0 1 2 3 4 5 19 20 Doppler Radar Introduced Expanded use of Doppler Radar 5

  6. 27/04/2012 $36 Bn $30Bn $19.6 Bn Kansas City 1.5x St Louis 4x Wichita Wichita Springfield Tulsa Oklahoma City Little Rock Memphis Atlanta Dallas Birmingham 2x Shreveport Jackson 21 22 East St Louis is 150% the size of Joplin in population Density Question 3 East St Louis 1896 $12-13 Bn Normalized to 2011 23 What do you predict for the Tornado and Hurricane season 2012? 6

  7. 27/04/2012 Question 4 25 Why did 2011 have so many tornados, any insights into 2012? Ingredients for forming Convective Storms, Why is ENSO so Important?..... Mesocyclones and Tornadoes …the Jet Streams La Nina El Nino Arctic High ENSO 27 28 7

Download Presentation
Download Policy: The content available on the website is offered to you 'AS IS' for your personal information and use only. It cannot be commercialized, licensed, or distributed on other websites without prior consent from the author. To download a presentation, simply click this link. If you encounter any difficulties during the download process, it's possible that the publisher has removed the file from their server.

Recommend


More recommend