
SLIDE 1
Nashville Downtown Partnership
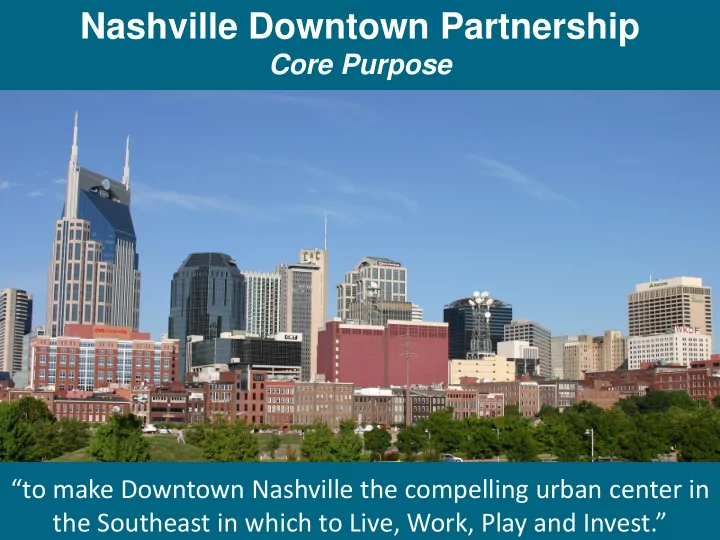
Core Purpose “to make Downtown Nashville the compelling urban center in the Southeast in which to Live, Work, Play and Invest.”
Nashville Downtown Partnership Core Purpose to make Downtown - - PowerPoint PPT Presentation
Nashville Downtown Partnership Core Purpose to make Downtown Nashville the compelling urban center in the Southeast in which to Live, Work, Play and Invest. Downtown Boundaries Jefferson Street to the north, the Cumberland River to the
Core Purpose “to make Downtown Nashville the compelling urban center in the Southeast in which to Live, Work, Play and Invest.”
Jefferson Street to the north, the Cumberland River to the east, and the interstate loop to the south and west
investments in downtown since 2000 > $2.8 billion
$519 million
“Periodically, a city has to have enough confidence in itself to invest in itself.”
Downtown Nashville
2008 2009 2010 Projected 2011 Own 54% 63% 75% 62% Rent 46% 37% 25% 38%
0% 10% 20% 30% 40% 50% 60% 70% 80%
– Began leasing in mid-February – Lease rates: $685 - $2,145 per month
– Leasing office opens April 18th
29% ar are 29 and under (Gener e 29 and under (Generation tion Y) Y)
36% ar are 30 e 30-45 (Gene 45 (Generation X tion X)
33% ar are 46 e 46-63 (Ba 63 (Baby B by Boomer
s)
6% ar are 64+ (V e 64+ (Veter eterans) ans)
49% ar are sing e single, 34% mar le, 34% married ried
erage ge household household siz size: 1.5 per e: 1.5 persons sons
Annual salar salary y range: 68% ear ange: 68% earn $60,000 n $60,000
more
63% colle college g ge gradu aduates, tes, an a an additiona ditional l 25% 25% wi with th post postgradua aduate te educa education tion
Source: Downtown Residential Survey, June, 2010
52% 54% 62% 46% 48% 50% 52% 54% 56% 58% 60% 62% 64% 2008 2009 2010
Residents that work outside of downtown
2 or 4 Year Degree Graduate or Professional Degree Downtown 63% 25% Nashville 27% 12% Nashville MSA 25% 9%
Urban Experience (#1) 54% Central Location/Convenience (#2) 43% Nightlife (#3) 35% Close to Work (#4) 31% Arts & Cultural Events (#4) 31%
– Born between 1981-1999 – Place value on community, dense, walkable environments and green development – 77% want to live in an urban core – 1/3 will pay more to walk to work, shops, entertainment – 2/3 say living in a walkable community is important
SOURCE: RCLCO Consumer Research, 2009
15
3,400,000 3,500,000 3,600,000 3,700,000 3,800,000 3,900,000 4,000,000 4,100,000 4,200,000 2000 2001 2002 2003 2004 2005 2006 2007 2008 2009 2010 2011 2012 2013 2014 2015 2016 2017 2018 2019 2020
Number of 22 Year Olds Same 22 Year Olds Turn 25
– 41% of Generation Y plan to rent for at least two years – 77% of Generation Y plan to live in an Urban Core
15 NOTE: Number of 22-year olds is based upon birth rate and does not factor in death rates and migration. SOURCE: U.S. Centers for Disease Control and Prevention
Largest group began graduating in 2009 – Greatest amount of new rental demand during this period Assuming this group rents for three years, they will hit the home buying market en masse in 2012, peaking in 2015
Walkability:
– Drivers: convenience, connectivity, healthy work-life balance to maintain relationships – 1/3 will pay more to walk to shops, work, and entertainment – More than 1/2 of Gen Y would trade density for proximity to shopping or to work – Even among families with children, one-third or more are willing to trade lot size and “ideal home” for walkable, diverse communities
In most metro areas, only 10% to 15% of the supply is delivered in these type of environments. Result is strong pent up demand for walkable urbanity that will take decades to satisfy at the current pace of delivery.
– Born between 1946 - 1964 – Entering an “urban phase” – 75% of retiring boomers want to live in urban settings – either central cities or walkable town centers
SOURCE: RCLCO Consumer Research, 2009
SAVE THE DATE! Thursday, April 14, 2011!
This is the loction for text concerning retail
New retail on Church Street this fall– FRESHII, METROPOLITAN WINES, and PUCKETT’S GRO. & RESTAURANT
Bath Junkie on 2nd Avenue
More than 20 galleries participate each month
Event calendar default page: displays current month’s events
www.nashvilledowntown.com www.parkitdowntown.com