SLIDE 1
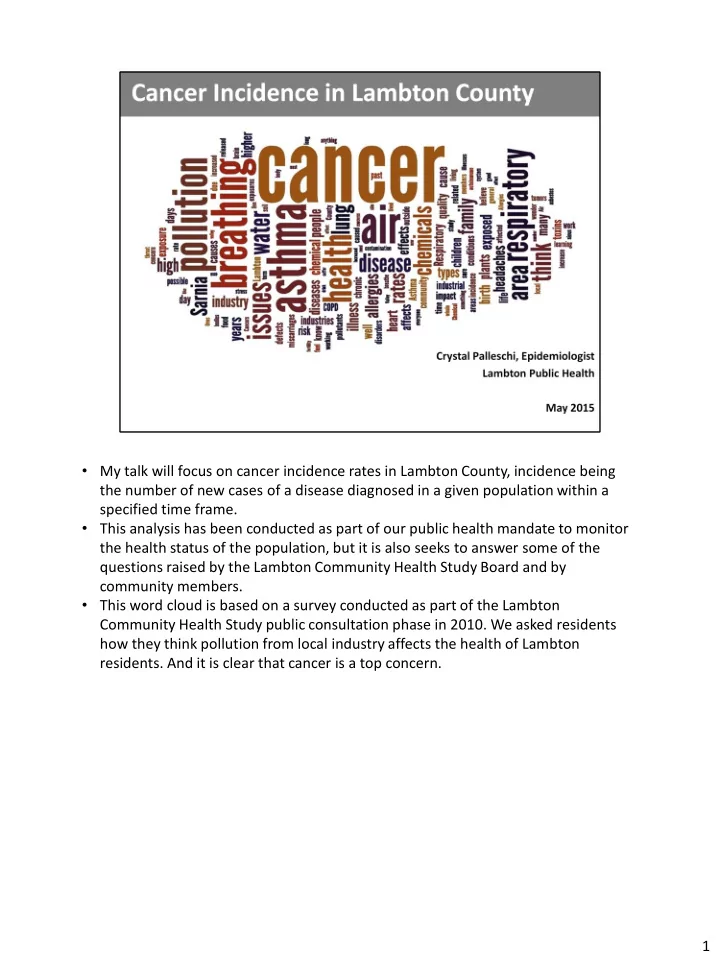
- My talk will focus on cancer incidence rates in Lambton County, incidence being
the number of new cases of a disease diagnosed in a given population within a specified time frame.
- This analysis has been conducted as part of our public health mandate to monitor
the health status of the population, but it is also seeks to answer some of the questions raised by the Lambton Community Health Study Board and by community members.
- This word cloud is based on a survey conducted as part of the Lambton
Community Health Study public consultation phase in 2010. We asked residents how they think pollution from local industry affects the health of Lambton
- residents. And it is clear that cancer is a top concern.
1
SLIDE 2
2
SLIDE 3
What I find is that this is a disease that evokes a lot of emotion, that most have been affected by this disease, whether it is a family member, friend or co-worker The fact is that it likely will affect us all… 2 out of 5 Canadians are expected to develop cancer in their lifetime 1 out of 4 are expected to die from it 3
SLIDE 4
There is clearly a perception that it does in this community. And while there is a relatively small proportion of the population who actively voice their concerns, I think there are many others who think that there is a higher risk of developing cancer here and either accept it or don’t think there is anything we can do about it. So, answering this question of whether it affects us more is really important. 4
SLIDE 5
- After the Lambton Community Health Study Board conducted a literature review
and public consultation activities in 2010, several research questions were identified, including these three questions related to cancer…
- Analyses related to the first two questions are hypothesis generating studies that
may reveal important research questions to be pursued further. So, the data presented here today cannot determine why people get cancer in Lambton, but answers the first simple, but important question of whether we differ from other areas of the province.
- While I haven’t included it in this presentation, the second question is being
addressed by a team of researchers I’ve been working with at Cancer Care Ontario and U of T.
- The first several slides will show data for all cancers combined to give a general
- verview. Since there are more than 100 types of cancer, I will then go on to
highlight the most common sites and those where our rates deviate from the provincial average. 5
SLIDE 6
- All the data shown here are taken from the Ontario Cancer Registry (distributed to
health units through Cancer Care Ontario). We receive this data at the public health unit level. The most recent release includes data up to 2009.
- Significant lag time to get new data, as it is a very labour intensive process.
- It is a passive registration system, meaning no one is legally required to report
each case to a coordinating body. The registry is reliant on administrative records from hospitals, regional cancer centres, pathology reports and death certificates. Records for each case are linked together to create the final registry or listing of Ontario cancer cases.
- Finally, data within the cancer registry is based on place of residence at time of
diagnosis, not on the location where treatment or care is received. 6
SLIDE 7
First we can look at the number of cases. This is useful for illustrating the burden of disease on the health care system. Certainly if you are thinking about service provision you want to know how many people you need to serve. 7
SLIDE 8
- Number of cases in Lambton County has increased from 564 in 1989 to 840 in
2009. 8
SLIDE 9
- Similarly, the number of cases has increased in the past 20 years in Ontario.
- Why might there be an increase? Why is the increase larger in Ontario vs.
Lambton? 9
SLIDE 10
- Virtually no growth in Lambton; nearly 30% increase in Ontario. More
people=more cases of cancer.
- So, we know that the number of cases has increased in both Lambton and Ontario.
We can guess that the increase in total population accounts for some of this increase in Ontario, but not Lambton. But, that is all we know and we cannot directly compare the two populations because they are different sizes. 10
SLIDE 11
We can compare two populations by simply dividing the number of cases by the total population. 11
SLIDE 12
- We can now show Lambton and Ontario on the same graph and see that the crude
rate has been higher in Lambton vs. Ontario over the last 20 years.
- After accounting for the increase in Ontario's population, the percent increase is
33% vs. 71%. Similar to the number of cases, Lambton's rate increased by 49%.
- However, there is a problem if the two populations are different with respect to
factors that are related to the outcome of interest. When talking about most health outcomes, including cancer, the outcome is strongly related to age. If you have an older population, you will have higher cancer rates than a younger
- population. So, you need to account for this.
12
SLIDE 13
You can calculate separate rates for each age and/or sex specific group. 13
SLIDE 14
- Here are age and sex-specific rates for males for the 10 year period, 2000-2009
combined.
- Age-specific rates among males under 55 are very similar in Lambton and Ontario.
Rates are higher in Lambton males over 55 compared to the province. 14
SLIDE 15
- Age-specific rates in Lambton females are similar to those in Ontario for most age
categories, but the rate does appear slightly higher in the 65-74 year age category.
- Age-specific rates can be very informative, but it is still difficult to make a direct
comparison between populations due to the number of different categories and rates. 15
SLIDE 16
Standardized or adjusted rates can help us to make these comparisons. We force two populations to look the same with respect to age and produce estimates that can be compared. 16
SLIDE 17
- By adjusting for age we have accounted for the fact that the population is aging in
both Lambton and Ontario and also the fact that Lambton's population is older than Ontario's. The percent increase over time is smaller and similar in Lambton and Ontario and Lambton's rates are closer to Ontario's. 17
SLIDE 18
- Sometimes we like to go beyond comparing Lambton to the provincial average.
The provincial average is influenced by rates in the GTA and larger cities, where population characteristics can be very different. For many chronic diseases, including most types of cancer, health units in the GTA have the lowest rates in the province.
- Here is a map based on the most recent three year period, 2007-09. It shows
health units that have incidence rates of all cancers that are lower, similar to or higher than the provincial average.
- Health units that are higher than the provincial average are in Southern, Central
and Northern Ontario. 18
SLIDE 19
- Each bar represents one of Ontario’s 36 health units; green line represents the
provincial average; error bars represent 95% confidence intervals – if these cross the provincial average we can generally conclude that there is no significant difference between that health unit and the provincial average.
- Lambton ranks 11/36 health units with respect to age-standardized incidence of all
cancers for the most recent three year period (2007-09). 19
SLIDE 20
- Top three in males account for 58% of all cases (Total cases=468)
- Top three in females account for 50% of all cases (Total cases=372)
20
SLIDE 21
- Standardized rate ratios allow us to compare Lambton rates to Ontario rates for a
number of cancer sites.
- The standardized rate ratio tells us if the rate in Lambton is higher or lower than
the rate in Ontario.
- If the SRR is higher than 1, the rate is higher in Lambton vs. Ontario. If it is lower
than 1, it is lower. If the 95% confidence interval (vertical line) does not cross 1, we say the difference is statistically significant.
- For males: All cancers (9%), colorectal (14%), lung (16%) and prostate (8%) are
slightly but significantly elevated. Melanoma is about 1.7 times or 70% higher than
- Ontario. Mesothelioma is over 5 times higher.
- There are significantly fewer cases of liver cancer in Lambton County males as
compared to Ontario. 21
SLIDE 22
- For females, all sites (4%) and lung (23%) are slightly, but significantly higher than
- Ontario. Mesothelioma is 3.3x higher among Lambton females, cancer of the
larynx is 2 time higher and melanoma (skin) is 1.6 or 63% higher than the Ontario
- average. Notice the large confidence intervals on larynx and mesothelioma. This is
a reflection of the small number of cases, even during a ten year period (17 larynx, 11 mesothelioma cases).
- There are significantly fewer cases of stomach and thyroid cancers in Lambton
County females compared to Ontario. 22
SLIDE 23
- Based on the 10 year period, 2000-2009:
- Rates are significantly elevated for:
melanoma (males & females) mesothelioma (males & females) larynx (females)
- Rates are slightly but significantly elevated for:
lung (males & females) colorectal (males) prostate
- Rates are significantly lower for:
liver (males) stomach (females) thyroid (females) 23
SLIDE 24
- Lung cancer incidence has been decreasing among males in both Lambton and
- Ontario. This decrease has been less pronounced in Lambton, so Lambton rates
have been higher than Ontario rates for most of the 20-year study period.
- There has been a slight increase in the incidence of lung cancer in Ontario females
- ver the past 20 years. Lung cancer incidence among Lambton females was similar
to the Ontario rate until the late 1990’s, increased to above provincial rates, and remained steady for the remainder of the study period.
- In 2011/12, smoking rates were higher among males in Lambton compared to
Ontario (27.6% vs. 23.9%), but this difference was not statistically significant. Rates were significantly higher among Lambton females compared to their provincial counterparts (24.0% vs. 17.0%). 24
SLIDE 25
- Lambton ranks 11/36 health units with respect to age-standardized incidence of
lung cancer in males for the most recent three year period (2007-09). 25
SLIDE 26
- Lambton ranks 17/36 health units with respect to age-standardized incidence of
lung cancer in females for the most recent three year period (2007-09). 26
SLIDE 27
- Age-standardized incidence of colorectal cancer among males has been relatively
steady over the past 20 years. Lambton’s rate has been slightly or significantly higher than Ontario’s rate throughout the study period. 27
SLIDE 28
- Lambton ranks 12/36 health units with respect to age-standardized incidence of
colorectal cancer in males for the most recent three year period (2007-09). 28
SLIDE 29
- The age-standardized incidence of mesothelioma among males is clearly higher
than the Ontario rate throughout the 20 year study period. Between 2005 and 2009 there was an average of 9 cases per year in Lambton County. Asbestos exposure is the primary risk factor for mesothelioma (http://www.mayoclinic.com/health/mesothelioma/DS00779/DSECTION=risk- factors). 29
SLIDE 30
- Lambton ranks 1/36 health units with respect to age-standardized incidence of
mesothelioma in males for the most recent three year period (2007-09). 30
SLIDE 31
- Age-standardized rates of melanoma of the skin have increased in Ontario males
and females over the past 20 years. While Lambton rates were similar to provincial rates until the late 1990’s, they increased to above provincial rates among both Lambton males and females and have remained significantly elevated throughout the rest of the study period. 31
SLIDE 32
- Lambton ranks 1/36 health units with respect to age-standardized incidence of
melanoma of the skin in males for the most recent three year period (2007-09). 32
SLIDE 33
- Lambton ranks 3/36 health units with respect to age-standardized incidence of
melanoma of the skin in females for the most recent three year period (2007-09). 33
SLIDE 34
- Age-standardized incidence rates of prostate cancer have increased in Ontario over
the 20 year study period. Lambton rates increased sharply in the early 1990’s and then leveled out to be close to the provincial average. (The sharp increase in the 1990’s may be related to higher initial uptake of the PSA screening test) 34
SLIDE 35
- Lambton ranks 6/36 health units with respect to age-standardized incidence of
prostate cancer in males for the most recent three year period (2007-09). 35
SLIDE 36
Not a simple yes or no answer. Cancer is a group of over 100 diseases, so the answer to this question may differ depending on cancer site, sex and age group and the time period examined. 36
SLIDE 37
Note: Very small number of cases of cancer of the larynx in females (17 cases in 10 years). 37
SLIDE 38
38