SLIDE 1
Best Fest Presentation.notebook 1 August 01, 2015
My Statistical Questions:
I have a playlist on my iPod for when I go running. A) How long are the songs in my running playlist? B) If I run for 40 minutes, how many songs might I get through if the songs are on shuffle?
6.SP.1, 6.SP.2
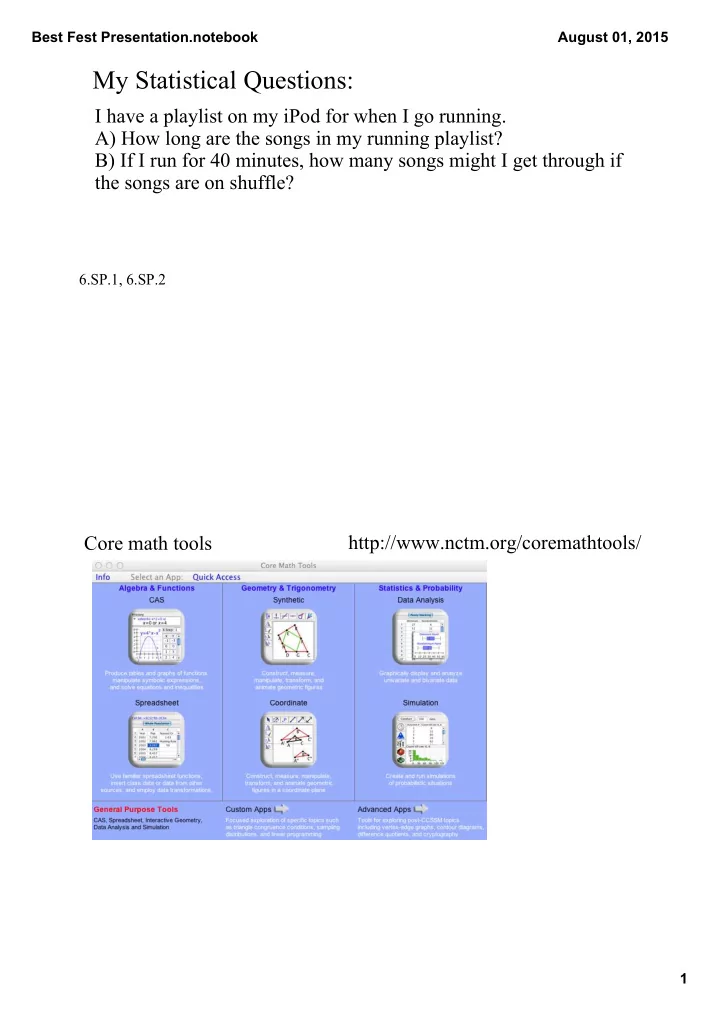
http://www.nctm.org/coremathtools/ Core math tools
SLIDE 2
Best Fest Presentation.notebook 2 August 01, 2015
Fathom (software for teaching stats) http://fathom.concord.org The AP Stats teachers have this and there is a free trial available. Song lengths (in seconds)
SLIDE 3
Best Fest Presentation.notebook 3 August 01, 2015
Data Distribution
Data are the values assumed by the particular variable of interest. The distribution of this variable is the values of the variable together with the frequency of each value.
DRAFT Missouri Mathematics Core Academic Standards 6th Grade Glossary
"All possible values and how frequently"
Dot plot
A method of visually displaying of data values where each data value is shown as a dot or mark above a number line. Also known as a line plot.
DRAFT Missouri Mathematics Core Academic Standards High School Glossary
SLIDE 4
Best Fest Presentation.notebook 4 August 01, 2015
Histograms
A graph that displays the data by using vertical bars of various heights to represent the frequencies of a distribution. The data is graphed in intervals.
DRAFT Missouri Mathematics Core Academic Standards 6th Grade Glossary
Song lengths (in seconds)
SLIDE 5
Best Fest Presentation.notebook 5 August 01, 2015
Song lengths (in seconds)
6.SP.2, 6.SP.4, 6.SP.5
Song lengths (in seconds)
6.SP.2, 6.SP.4, 6.SP.5
SLIDE 6 Best Fest Presentation.notebook 6 August 01, 2015
Song lengths (in seconds)
6.SP.2, 6.SP.4, 6.SP.5
Median
A measure of center in a set of numerical data. The median of a list
- f values is the value appearing at the center of a sorted version of
the list – or the mean of the two central values, if the list contains an even number of values.
DRAFT Missouri Mathematics Core Academic Standards 6th Grade Glossary
"The middle, when in order"
SLIDE 7
Best Fest Presentation.notebook 7 August 01, 2015
Quartiles
The value called the first quartile appears at the center of the lower half of a sorted version of a numerical list; the value called the third quartile appears at the center of the upper half of a sorted version of a numerical list.
Missing from the DRAFT Missouri Mathematics Core Academic Standards
"The middle of each ordered half"
Box Plot
A method of visually displaying a distribution of data values by using the median, quartiles, and extremes of the data set. A box show the middle 50% of the data.
DRAFT Missouri Mathematics Core Academic Standards 6th Grade Glossary
SLIDE 8
Best Fest Presentation.notebook 8 August 01, 2015
Interquartile range (IQR)
A measure of variation in a set of numerical data, the interquartile range is the distance between the first and third quartiles of the data set
DRAFT Missouri Mathematics Core Academic Standards 6th Grade Glossary
"The spread of the middle half" Song lengths (in seconds)
SLIDE 9
Best Fest Presentation.notebook 9 August 01, 2015
Song lengths (in seconds)
6.SP.2, 6.SP.4, 6.SP.5
Outliers
Data that are more than 1.5 times the interquartile range from the quartiles.
DRAFT Missouri Mathematics Core Academic Standards 8th Grade Glossary
SLIDE 10
Best Fest Presentation.notebook 10 August 01, 2015
Song lengths (in seconds)
6.SP.2, 6.SP.4, 6.SP.5, S.ID.1, S.ID.2
How many grandkids do you have? 1, 1, 2, 3, 3, 3, 4, 4, 4, 5, 5, 6
Human Boxplot
6.SP.2, 6.SP.4, 6.SP.5, S.ID.1, S.ID.2
SLIDE 11
Best Fest Presentation.notebook 11 August 01, 2015
How many grandkids do you have? 1, 1, 2, 3, 3, 3, 4, 4, 4, 5, 5, 6
Human Boxplot
Another person joins the group and that person has 9 grandkids.
6.SP.2, 6.SP.4, 6.SP.5, S.ID.1, S.ID.2
Roller coaster lengths (ft.) via rcdb.com A Worlds of Fun B Silver Dollar City C Six Flags St. Louis D Cedar Point
SLIDE 12
Best Fest Presentation.notebook 12 August 01, 2015
Roller coaster lengths (ft.) A Worlds of Fun B Silver Dollar City C Six Flags St. Louis D Cedar Point
6.SP.2, 6.SP.4, 6.SP.5, S.ID.1, S.ID.2
Which month was busiest, based on email volume? Which month was hardest to predict what my inbox would look like from one day to the next?
6.SP.2, 6.SP.4, 6.SP.5, S.ID.1, S.ID.2
SLIDE 13
Best Fest Presentation.notebook 13 August 01, 2015
Mean
A measure of center in a set of numerical data, computed by adding the values in a list and then dividing by the number of values in the list.
DRAFT Missouri Mathematics Core Academic Standards 6th Grade Glossary
"Add them up and divide by how many"
Mean absolute deviation
A measure of variation in a set of numerical data, computed by adding the distances between each data value and the mean, then dividing by the number of data values.
DRAFT Missouri Mathematics Core Academic Standards 6th Grade Glossary
"The average distance from the mean"
SLIDE 14
Best Fest Presentation.notebook 14 August 01, 2015
Standard deviation
A measure of the dispersion (i.e., the degree to which data are spread out) of a set of data relative to the mean.
DRAFT Missouri Mathematics Core Academic Standards High School Glossary
"Another type of average distance from the mean" Song lengths (in seconds) mean = 339.73 Q1 = 241.5 median = 328 Q3 = 421.5 sample standard deviation (s) = 106.19 mean absolute deviation (MAD) = 88.75 interquartile range (IQR) = 180
6.SP.5, S.ID.2
SLIDE 15
Best Fest Presentation.notebook 15 August 01, 2015
set 1 set 2 20 10 38 36 50 65 60 69 62 70 50 50 60 60 22.85 26.37 16.8 21.6 mean range sample standard deviation (s) mean absolute deviation (MAD)
A tale of two data sets
6.SP.5, S.ID.2
Calculating Standard Deviation and MAD
Four runners' distances for each of 5 days: Aaron Beth Caleb Donna 10 8 7 3 10 9 9 3 10 10 10 4 10 11 11 5 10 12 13 35 10 10 10 10 1.58 2.23 14 1.2 1.6 10 mean s MAD
6.SP.5, S.ID.2
SLIDE 16
Best Fest Presentation.notebook 16 August 01, 2015
How changes in data affect statistics
How many letters are in your first name? Lengths 3 4 5 5 6 6 7 mean median s MAD range IQR 5.14 5 1.35 1.02 4 2 Suppose Dan decides to change his name to Daniel. mean median s MAD range IQR 5.57 6 .98 .78 3 1
6.SP.5, S.ID.2, S.ID.3
How changes in data affect statistics
How many letters are in your first name? Lengths 3 4 5 5 6 6 7 mean median s MAD range IQR Suppose Chris decides to change his name to Christopher. 5.14 5 1.35 1.02 4 2 mean median s MAD range IQR 6 6 2.58 1.71 8 3
6.SP.5, S.ID.2, S.ID.3
SLIDE 17
Best Fest Presentation.notebook 17 August 01, 2015
How changes in data affect statistics
How many letters are in your first name? Lengths 3 4 5 5 6 6 7 mean median s MAD range IQR Suppose a new student, Jenna, joins the class. 5.14 5 1.35 1.02 4 2 mean median s MAD range IQR 5.13 5 1.25 .91 4 1.5
6.SP.5, S.ID.2, S.ID.3
How changes in data affect statistics
How many letters are in your first name? Lengths 3 4 5 5 6 6 7 mean median s MAD range IQR Suppose a new student, Maximillian, joins the class. 5.14 5 1.35 1.02 4 2 mean median s MAD range IQR 5.59 5.5 2.42 1.63 8 2
6.SP.5, S.ID.2, S.ID.3
SLIDE 18
Best Fest Presentation.notebook 18 August 01, 2015
Simulation
A model of an experiment that might be impractical to carry out.
DRAFT Missouri Mathematics Core Academic Standards 7th Grade Glossary
SLIDE 19
Best Fest Presentation.notebook 19 August 01, 2015
Only 85 of the 1000 simulated shuffled playlists included an average of 6 songs taking longer than 40 minutes.
6.SP.4, S.ID.1, S.IC.2
Only 148 of the 1000 simulated shuffled playlists included an average of 8 songs in under 40 minutes.
6.SP.4, S.ID.1, S.IC.2
SLIDE 20 Best Fest Presentation.notebook 20 August 01, 2015
Suppose that at a certain company, 15 female employees and 10 male employees have expressed interest in serving on a 5 person committee to negotiate a new contract. A random drawing is held and no women are chosen. The women who had wished to serve
- n the negotiating team cry foul. How unusual is this sort of an
event?
Another simulation
S.ID.1, S.IC.2
Only 1 of the 100 simulated committees was exclusively male.
S.ID.1, S.IC.2
SLIDE 21 Best Fest Presentation.notebook 21 August 01, 2015
(Based on "Random Walk" items from illustrativemathematics.org)
Another simulation
Tom is standing at zero on a number line. He will toss a coin and move right if it lands on heads and left if it lands on tails. If he does this once, where might he stand? Estimate his chances of standing in each location. What if he tosses the coin twice? What if he tosses the coin four times?
S.ID.1, S.IC.1
Another simulation
http://www.personal.psu.edu/dpl14/java/probability/plinko/
SLIDE 22 Best Fest Presentation.notebook 22 August 01, 2015
Suppose that someone gave me a coin. I flipped it 50 times and calculated the proportion of tails. I repeated the process again and again until I calculated 25 proportions, one for each of 25 trials (with 50 tosses in each trial). I then made a histogram of the results for for these 25 trials as shown below. Based on this histogram, do you think that the coin is fair? Why or why not?
Analyzing the results of a simulation
S.ID.1, S.IC.1, S.IC.2
Tree diagrams
A diagram used to find all the possible permutations (arrangement
- f objects in a particular order).
DRAFT Missouri Mathematics Core Academic Standards 7th Grade Glossary
SLIDE 23
Best Fest Presentation.notebook 23 August 01, 2015
Event
A subset of a sample space for a given experiment
DRAFT Missouri Mathematics Core Academic Standards 7th Grade Glossary
Uniform probability model
A probability model in which all outcomes have equal probabilities.
DRAFT Missouri Mathematics Core Academic Standards 7th Grade Glossary
SLIDE 24
Best Fest Presentation.notebook 24 August 01, 2015
Addition Rule
Used to determine the probability that event A or event B occurs or both occur. The rule is often written as: P(A or B) = P (A) + P(B) – P(A and B)
DRAFT Missouri Mathematics Core Academic Standards High School Glossary
Spinner A has 8 spaces and spinner B has 5 spaces.
X 1 2 3 4 5 6 7 8 P(x) .125 .125 .125 .125 .125 .125 .125 .125 X 1 2 3 4 5 P(x) .2 .2 .2 .2 .2
S.CP.1, S.MD.1, S.MD.3
SLIDE 25
Best Fest Presentation.notebook 25 August 01, 2015
Compound events
A compound event consists of two or more outcomes or simple events.
DRAFT Missouri Mathematics Core Academic Standards 7th Grade Glossary
Spinning orange and a 6. Spinning purple and a 5. Spinner A has 8 spaces and spinner B has 5 spaces.
X 2 3 4 5 6 7 8 9 10 11 12 13 P(x) 1/40 2/40 3/40 4/40 5/40 5/40 5/40 5/40 4/40 3/40 2/40 1/40
Suppose we spin each and find the sum of the outcomes.
S.CP.1, S.MD.1, S.MD.3
SLIDE 26
Best Fest Presentation.notebook 26 August 01, 2015 X 2 3 4 5 6 7 8 9 10 11 12 13 P(x) 1/40 2/40 3/40 4/40 5/40 5/40 5/40 5/40 4/40 3/40 2/40 1/40
If we spin each spinner and find the sum, what would we expect the sum to be? That is, what's the average sum?
S.MD.2
Well, 2 happens 1/40 of the time, 3 happens 2/40 of the time... So, 2 • 1/40 + 3 • 2/40 + 4 • 3/40 + ... + 12 • 2/40 + 13 • 1/40 = 7.5
Compound events
For one roll of a die, having it land on a number that is both odd and prime.
SLIDE 27
Best Fest Presentation.notebook 27 August 01, 2015
Two way table
Used to show the relationship between twovariables.
DRAFT Missouri Mathematics Core Academic Standards 8th Grade Glossary
Joint frequencies
Entries in the body of a frequency table. Values on the horizontal and vertical margins are not included.
DRAFT Missouri Mathematics Core Academic Standards High School Glossary
SLIDE 28
Best Fest Presentation.notebook 28 August 01, 2015
Marginal relative frequencies
Entries in the "Total" row and "Total" column are called marginal frequencies.
DRAFT Missouri Mathematics Core Academic Standards High School Glossary
Conditional relative frequencies
The relative frequencies in the body of the twoway table.
DRAFT Missouri Mathematics Core Academic Standards High School Glossary
SLIDE 29
Best Fest Presentation.notebook 29 August 01, 2015
2 3 4 prime 1 5 even The smallest 16 Whole Numbers 6 7 8 9 10 12 13 14 11 15
prime not prime even not even
16 counts from the Venn diagram
S.CP.1, S.CP.4, S.MD.1, S.MD.3
What's the probability that a randomly selected... whole number under 16 is prime? whole number under 16 is even? prime under 16 is even? whole number under 16 is even and prime? whole number under 16 is even or prime? whole number under 16 is neither prime nor even?
S.CP.1, S.CP.3, S.CP.6, S.CP.7
SLIDE 30
Best Fest Presentation.notebook 30 August 01, 2015
defective underweight Quality control testing found 4% of a company's product was defective, 5% was underweight, and 1% was both defective and underweight.
What's the probability that a randomly selected... product is underweight but not defective? product is defective but not underweight? product is defective or underweight?
S.CP.1, S.CP.7
Independence/Independent events
In probability, when the outcome of one event does not depend on the outcome of another event.
DRAFT Missouri Mathematics Core Academic Standards High School Glossary
SLIDE 31 Best Fest Presentation.notebook 31 August 01, 2015
Conditional probability
The probability that an event B occurs after an event A has already
DRAFT Missouri Mathematics Core Academic Standards High School Glossary
P(B | A) = P(B & A) P(A) If P(defective) = .04, P(underweight) = .05, P(both) = .01, why are "underweight" and "defective" not independent? P(defective & underweight) ≠ P(defective) x P(underweight) probabilities not equal, therefore events not independent S.CP.2
SLIDE 32 Best Fest Presentation.notebook 32 August 01, 2015
If P(defective) = .04, P(underweight) = .05, P(both) = .01, why are "underweight" and "defective" not independent? P(defective | underweight) = .01 ÷ .05 = .2 P(defective) ≠ P(defective | underweight)
P(underweight | defective) = .01 ÷ .04 = .25 P(underweight) ≠ P(underweight | defective) probabilities not equal, therefore events not independent S.CP.3 Tom is looking for the "perfect" car. Based on his research, 40% are loud, 30% are fast, and 12% are both loud and fast. If Tom's research is correct, are loud and fast independent? P (loud & fast) = P(loud) x P(fast) probabilities are equal, therefore events are independent S.CP.2
SLIDE 33 Best Fest Presentation.notebook 33 August 01, 2015
P(loud | fast) = .12 ÷ .3 = .4 P (loud) = .4
P(fast | loud) = .12 ÷ .4 = .3 P (fast) = .3 probabilities are equal, therefore events are independent Tom is looking for the "perfect" car. Based on his research, 40% are loud, 30% are fast, and 12% are both loud and fast. If Tom's research is correct, are loud and fast independent? S.CP.3
Scatter plots
A graph in the coordinate plane representing a set of bivariate data. For example, the heights and weights of a group of people could b displayed on a scatter plot.
DRAFT Missouri Mathematics Core Academic Standards 8th Grade Glossary
SLIDE 34
Best Fest Presentation.notebook 34 August 01, 2015
Positive association
A relationship between variables such that as one variable increases, the other variable also increases.
DRAFT Missouri Mathematics Core Academic Standards 8th Grade Glossary
Negative association
A relationship between variables such that as one variable increases, the other variable also increases.
Correlation coefficient
A number between 1 and 1 that measures the strength and the direction of a linear relationship between two variables.
DRAFT Missouri Mathematics Core Academic Standards High School Glossary
Causation
An action or occurrence that causes another.
SLIDE 35
Best Fest Presentation.notebook 35 August 01, 2015
Residuals
Residual (or error) represents unexplained (or residual) variation after fitting a regression model. It is the difference (or left over) between the observed value of the variable and the value suggested by the regression model.
DRAFT Missouri Mathematics Core Academic Standards High School Glossary
"Observed minus Predicted"
Slope
The ratio of change in the vertical axis (yaxis) to each unit change in the horizontal axis (xaxis) in the form rise/run or Δx/Δy. Also, the constant, m, in the linear equation for the slopeintercept form, y=mx + b.
DRAFT Missouri Mathematics Core Academic Standards High School Glossary
SLIDE 36 Best Fest Presentation.notebook 36 August 01, 2015
Powder Keg (98,64) Mamba (205,75)
Patriot (149,60) Mine Train (32,37) Wildfire (120,66) Spinning Dragons (54,31) The Boss (122,66.3) Boomerang (116.5,47) Outlaw Run (107,68)
8.SP.1
SLIDE 37
Best Fest Presentation.notebook 37 August 01, 2015
Explore with a movable line Show the Least Squares Regression Line 8.SP.1, 8.SP.2 S.ID.6 y=0.224x+29.727 8.SP.3, S.ID.6, S.ID.7
SLIDE 38 Best Fest Presentation.notebook 38 August 01, 2015
Show residuals
Powder Keg (98,64) 12.34 Mamba (205,75) 0.6
- Mr. Freeze (218,70) 8.56
Patriot (149,60) 3.08 Mine Train (32,37) 0.11 Wildfire (120,66) 9.41 Spinning Dragons (54,31) 10.81 The Boss (122,66.3) 9.26 Boomerang (116.5,47) 8.8 Outlaw Run (107,68) 14.32
S.ID.6 Show residual plot
Powder Keg (98, 12.34) Mamba (205, 0.6)
Patriot (149, 3.08) Mine Train (32, 0.11) Wildfire (120, 9.41) Spinning Dragons (54, 10.81) The Boss (122, 9.26) Boomerang (116.5, 8.8) Outlaw Run (107, 14.32)
S.ID.6
SLIDE 39
Best Fest Presentation.notebook 39 August 01, 2015
S.ID.6 Show squared residuals Show means
SLIDE 40
Best Fest Presentation.notebook 40 August 01, 2015
S.ID.8 "pass the tape" is a variation on "the wave" Time how many seconds it takes for students to pass a roll of tape. Vary the number of students. 8.SP.1, 8.SP.2, 8.SP.3, S.ID.6, S.ID.7, S.ID.8
SLIDE 41
Best Fest Presentation.notebook 41 August 01, 2015
Correlation vs. Causation: ice cream sales vs. shark attacks sunblock sales vs. shark attacks number of firefighters at a call vs. cost of damage to a structure a child's shoe size vs. size of a child's vocabulary heating bill vs. indoor relative humidity number of police per mile vs. average speed of drivers S.ID.9 Sources for data amstat.org/censusatschool Wikipedia.com Studentgenerated 2 variable time "the wave" or for various numbers of students to pass some object around the room Studentgenerated single variable number of pets they have, value of coins in pockets, number of eyelets on their shoes, number of contacts in their phones, pulse Weather.com HomeDepot.com gasbuddy.com tacobell.com carmax.com rcdb.com Anscombe's four data sets
SLIDE 42 Best Fest Presentation.notebook 42 August 01, 2015
Examples I've used in class (just to give you some ideas)
- 1. What is the most important difference
between Phoenix, Orlando, and San Juan? Which of those 3 cities is most similar in this respect to Palm Springs?
Elmer and Ethel have retired and want to move someplace warm. The couple is considering nine different cities. The dotplots below show the distribution of average daily high temperatures in December, January, and February for each of these cities. Help them pick a city by answering the questions below, based on the data shown in the graph.
SLIDE 43
Best Fest Presentation.notebook 43 August 01, 2015
Here are the number of calories per item for 16 convenience store sandwiches, along with a dotplot of the data. 360 430 440 440 440 450 450 460 470 480 480 490 490 490 500 510 Describe the shape, center, and spread of the distribution. Are there any outliers? How does the annual energy cost (in dollars) compare for toploading washing machines and frontloading washers? The data below is from the Home Depot website. There are 26 frontloaders and 32 toploaders included.
SLIDE 44 Best Fest Presentation.notebook 44 August 01, 2015
How do gas prices in St. Charles County compare to those in Madison County, where Alton, Illinois is located? A sample of gas prices was taken several days in July 2015. Make a backtoback stemplot and compare the distributions.
2.56, 2.56, 2.57, 2.57, 2.58, 2.58, 2.58, 2.58, 2.59, 2.59, 2.59, 2.59, 2.60, 2.60, 2.61 Madison Co.: 2.67, 2.68, 2.69, 2.69, 2.70, 2.70, 2.70, 2.71, 2.71, 2.71, 2.71, 2.72, 2.72, 2.73, 2.74 Wins in Major League Baseball: The stemplot below shows the number
- f wins for each of the 30 Major League Baseball teams in 2014.
Key: 7|1 represents a team with 71 wins.
Calculate and interpret the percentiles for the St. Louis Cardinals, who had 90 wins, the Milwaukee Brewers, who had 82 wins, and the Los Angeles Angels, who had 98 wins.
SLIDE 45
Best Fest Presentation.notebook 45 August 01, 2015
Bridgette Jordan of Sandoval, Illinois (as of 2014), a town about 86 miles east of St. Charles, is one of the shortest women in the world, standing at 27 inches. Robert Wadlow was born in Alton, Illinois and passed away in 1940, at age 22, with a height of 107.1 inches.
SLIDE 46
Best Fest Presentation.notebook 46 August 01, 2015
Obviously, Bridgette is shorter than most women and Robert was taller than most men —but whose height is more unusual, relatively speaking? That is, relative to other adults, who is taller? We’ll say that that women have a mean of 64 in. and a standard deviation of 2.5 in. and that the mean height of men is 69.5 in. with a standard deviation of 2.8 in. Here is a dotplot of Kobe Bryant’s point totals for each of the 82 games in the 20082009 regular season. The mean of this distribution is 26.8 with a standard deviation of 8.6 points. In what percentage of games did he score within one standard deviation of his mean? …within two standard deviations?
SLIDE 47
Best Fest Presentation.notebook 47 August 01, 2015
Here is a dotplot of Tim Lincecum’s strikeout totals for each of the 32 games he pitched in during the 2009 regular season. The mean of this distribution is 8.2 with a standard deviation of 2.8. In what percentage of games were his strikeouts within one standard deviation of his mean? …within two standard deviations? The distribution of blood glucose levels (after 4 hours of fasting and measured in mg/dL) is approximately Normal and the middle 95% of scores are between 70 and 110. What are the mean and standard of this distribution? Can you calculate the percent of scores that are above 80 using the 689599.7 Rule? Explain.
SLIDE 48 Best Fest Presentation.notebook 48 August 01, 2015
Track and Field Day! The table below shows data for 13 students in a statistics class. Each member of the class ran a 40yard sprint and then did a long jump (with a running start). Make a scatterplot of the relationship between sprint time (in seconds) and long jump distance (in inches). The following scatterplot shows the lengths (in 1000s of feet) and the speeds (in miles/hour) for the 78 roller coasters I rode from Oct. 2007 to
- Aug. 2009. Describe the relationship between length and speed.
SLIDE 49
Best Fest Presentation.notebook 49 August 01, 2015
guess the correlation applet correlation applet
Get a sense of various values of correlation. Try a circle, parabola, 4 corners of a square, & see the effect of outliers.
http://www.istics.net/Correlations/ bcs.whfreeman.com/tps5e/default.asp#923932__929340__ http://www.tylervigen.com/spuriouscorrelations
SLIDE 50
Best Fest Presentation.notebook 50 August 01, 2015
Used Ford Escapes: The following scatterplot shows the number of miles driven (in thousands) and advertised price (in thousands) for 11 used Ford Escapes from the 20122014 model years. The regression line shown on the scatterplot is = 24600 0.114x a) Interpret the slope and y intercept of a regression line. b) Predict the price of a used Escape with 50,000 miles. (c) Calculate and interpret the residual for the Ford Escape with 57,000 miles and an asking price of $15,599.
SLIDE 51 Best Fest Presentation.notebook 51 August 01, 2015
Example: 12 of Taco Bell’s chicken menu items: (a)Calculate the equation of the leastsquares regression line using technology. Make sure to define variables! Sketch the scatterplot with the graph of the leastsquares regression line. (b)Interpret the slope and yintercept in context. (c)Calculate and interpret the residual for the first item listed, the Chicken Burrito Supreme, with 12g
In addition to other factors affecting climate, temperatures generally tend to decrease as one moves north from the equator to the North Pole. Here are average June high temperatures and latitude for 12 cities along the US east coast.
SLIDE 52
Best Fest Presentation.notebook 52 August 01, 2015
r=0.816 = 3 + 0.5x strange fact
Which of the following has the highest correlation? (Anscombe data sets)
Imagine a scatterplot heights & weights of H. S. students Form, Direction, Strength? Add Shaquille O'Neal (7'1", 325 lbs.) Outlier in height or weight? Still fit the overall pattern? Influential? Add sumo wrestler Kasugao Katsumasa (6'0", 340 lbs.) Outlier in height or weight? Still fit the overall pattern? Influential? Add Manute Bol, (7'6" 200 lbs) Outlier in height or weight? Still fit the overall pattern? Influential?
SLIDE 53 Best Fest Presentation.notebook 53 August 01, 2015
WAIS (IQ) scores are approx. normal (avg.) µ = 110 (std. dev.) σ = 25 Draw and label a normal curve. What proportion of scores are... between 85 and 135? between 60 and 160? between 110 and 135? between 60 and 85? between 60 and 135?
SLIDE 54
Attachments David Little Plinko