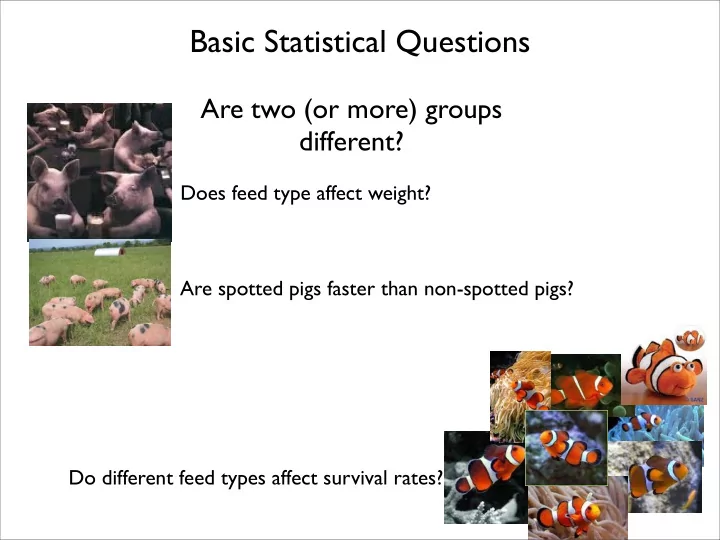

Basic Statistical Questions Are two (or more) groups different? Does feed type affect weight? Are spotted pigs faster than non-spotted pigs? Do different feed types affect survival rates?
Basic Statistical Questions Basic Statistical Questions Is there a relationship between a dependent and one or more independent variables? Independent variable: A variable that can be manipulated by a researcher, or varies naturally without human intervention. Often called a treatment or a dose. Dependent variable: A variable that responds to or may respond to one or more independent variables. Often called response. Questions one might ask: Is there a relationship between the water temperature in the bay and the concentration of viruses? Is there a relationship between Providence River flow rates and phosphate concentrations in the upper bay?
Population vs. Sample • Population: every individual of a particular group that exists anywhere in the universe. • Sample: a subset of the population on which some measurement/study is conducted.
Experimental units and replication Consider a statistical question: Are two groups different? Consider average tail length on: Irish Wolfhounds Compared to: Some fuzzy rat dog
We need a sample of each population Replicate or Experimental Unit: The smallest unit to which a treatment (or measurement) is independently applied.
Could we be wrong?
Results? • Can you guess what the results of the tail-length study might be? • Is that really what we want to evaluate?
Types of Data • Ratio • Most data that you see will probably be here • Anything that can be “twice” or “half” as much (lengths, weights, speeds etc.) • Constant interval size (linear change, not log). • Physically meaningful zero point. Not a human-dictated arbitrary zero.
Types of Data • Interval • This is almost like Ratio data, but there is no physically meaningful zero point. • Temperature in °C and °F fall into this category. How about K? • What about time? • What about latitude and longitude? • Still need a constant interval.
Types of Data • Ordinal • As in “in order” • We might have an order without actual numbers. (e.g. letter grades) • It may not be possible to measure exactly • Or, the statistical evaluation might require that ordinal data be used, even if exact measurements are available (more on that later).
Types of Data • Categorical (also called Nominal) • As in “categories” or “names” • Genetic phenotypes (e.g. brown hair, green eyes, etc.), taxonomy, etc. • Basically, anything that can be used to define a group. • Consider our basic question: Are two or more groups different? Categorical variables define the groups.
Types of Data • For Ratio and Interval Data the data can be, • continuous- any value is possible • discrete- the possible values move in steps. For example, age in years.
In JMP Categorical/Nominal Ratio/Interval Ordinal Note: JMP does not seem to differentiate continuous from discrete directly. But appears to treat discrete as ordinal.
What about the following? Ratio, Interval, Ordinal, Categorical, Continuous, Discrete? 1. Number of Right Whale calves observed in 2014 2. Clown fish diet type 3. Water salinity 4. Shoe sizes 5. Root/Shoot mass
Basic Statistical Questions • What data should I collect? • What is your hypothesis? • What statistical tests will you be using? • How willing are you to be wrong (statistical power is determined by the sample size)? • In addition to your specific hypothesis, are there other variables (both dependent and independent) that might play a role? If so, you better measure them now, because it’s unlikely you will be able to go back. • What have other studies done? Are their data well behaved (e.g. normal distribution/bell curve)
Recommend
More recommend