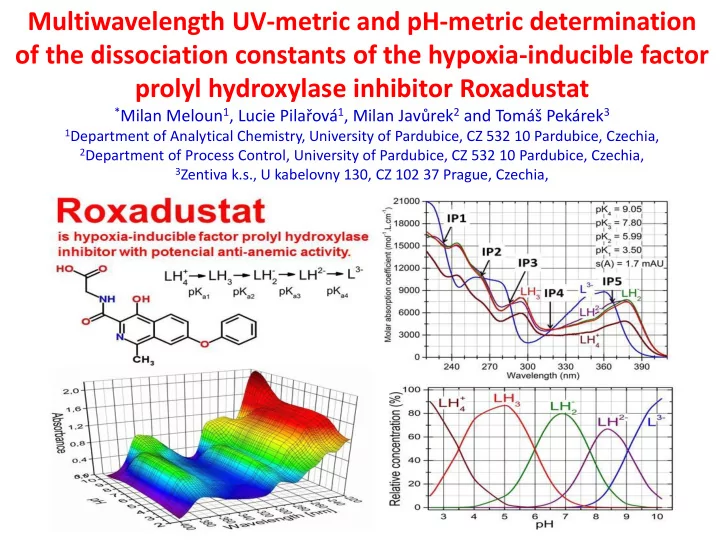
multiwavelength uv metric and ph metric determination
play

Multiwavelength UV-metric and pH-metric determination of the - PowerPoint PPT Presentation

Multiwavelength UV-metric and pH-metric determination of the dissociation constants of the hypoxia-inducible factor prolyl hydroxylase inhibitor Roxadustat * Milan Meloun 1 , Lucie Pilaov 1 , Milan Javrek 2 and Tom Pekrek 3 1


  1. Multiwavelength UV-metric and pH-metric determination of the dissociation constants of the hypoxia-inducible factor prolyl hydroxylase inhibitor Roxadustat * Milan Meloun 1 , Lucie Pilařová 1 , Milan Javůrek 2 and Tomáš Pekárek 3 1 Department of Analytical Chemistry, University of Pardubice, CZ 532 10 Pardubice, Czechia, 2 Department of Process Control, University of Pardubice, CZ 532 10 Pardubice, Czechia, 3 Zentiva k.s., U kabelovny 130, CZ 102 37 Prague, Czechia,

  2. Abstract Structural formula of Roxadustat Roxadustat belongs to Active Pharmacenutical Roxadustat is an orally bioavailable, hypoxia-inducible factor Ingredients, which have acidic/basic functionalities, prolyl hydroxylase inhibitor with potential anti-anemic activity their ionization state is controlled by solution pH and acid dissociation constants. Nonlinear regression of the pH-spectra with programs REACTLAB and SQUAD84 and of the pH- titration curve with ESAB determined four multiple consecutive dissociation constants with the protonation scheme. A sparingly soluble molecule LH 3 of Roxadustat - , LH 2- and L 3- was dissociated to soluble anions LH 2 + in an aqueous medium. or protonated to cation LH 4 - and LH 2- are The graph of molar absorption coefficients shows that the spectra of two anions LH 2 nearly the same. The Roxadustat spectrum exhibited five sharp isosbestic points, which were related to the LH 2- /L 3- equilibrium. Four consecutive thermodynamic dissociation constants were estimated using UV-metric data p K T a1 = 3.60(04), p K T a2 = 5.62(14), p K T a3 = 7.66(16), p K T a4 = 9.08(02) at 25 ° C and p K T a1 = 3.60(04), p K T a2 = 5.73(10), p K T a3 = 7.52(10), p K T a4 = 8.99(02) at 37 ° C and using pH-metric data p K T a1 = 4.33(09), p K T a2 = 6.57(11), p K T a3 = 8.88(05), p K T a4 = 9.03(04) at 25 ° C and p K T a1 = 4.25(09), p K T a2 = 6.49(10), p K T a3 = 8.80(06), p K T a4 = 9.00(05) at 37 ° C. The positive values of enthalpy Δ H 0 showed the dissociation process is endothermic and positive values of the Gibbs free energy Δ G 0 at 25 ° C indicated the dissociation process was not spontaneous. Four macro-dissociation constants of Roxadustat and six protonation locations were predicted by MARVIN and ACD/Percenta.

  3. (a) The 3D-absorbance response surface on pH for Roxadustat and (b) Predicted species of the protonation contained 1 cation, 3 anions, 1 ampholyte and 1 neutral molecule. (c) Molecular structure of Roxadustat (inset) with highlighted basic centres A, B, C, D, E and F and predicted p K a values using MARVIN/ACD prediction. Structure of auxiliary fragments 1-3 and their predicted p K a . (d) The distribution diagram of the relative concentrations [%] of protonated species of Roxadustat.

  4. (a) The entire spectrum of Roxadustat was divided into three following subspectra (b), (c) and (d). By changing solution pH in the range of pH 1 to pH n , the absorbance of a chromophore was changed and marked here as Delta A , and this change has to be examined in three pH ranges: (b) Small changes of the absorbance marked Delta A (the right axes on b) were detected in estimation of the p K 1 in the pH range of pH 1 = 2.6 to pH n = 4.2, as well as (c) the estimation of the p K 2 and p K 3 in the pH range of pH 1 = 4.2 to pH n = 8.1. (d) Sufficiently large changes of the absorbance occured only in estimation of the p K 4 in the range of pH 1 = 8.2 to pH n = 11.6. (e) The modification of the Cattel’s scree plot log s k ( SV ) = f ( k ) of the of singular value decomposition SVD served to the rank estimation of the absorbance matrix. The residual standard deviation RSD lead to k * = 5 and (f) in logarithmic scale is lead to k * = 5 which means that it was valid that n c = 5, (INDICES in S-PLUS), [42].

  5. Typical SQUAD84 working environment searching and testing the best protona- tion model of Roxadustat in the pH range from 2,5 to 11,6 for a model of two, three and four dissociation constants p K a1 , p K a2 , p K a3 , p K a4 at I = 0.0026 and 25 ° C. Left: The pure spectra profiles of molar absorptivities vs . wavelength (nm) for all of the variously protonated species of Roxadustat. Right: The distribution diagram of the relative concentrations of all of the variously protonated species in dependence on pH, (REACTLAB, ORIGIN 9).

  6. (a) The entire spectrum of Roxadustat in 220 – 410 nm is distinguished into five absorption bands with five isosbestic points. Isosbestic points regarded a protonation equilibrium LH 2- /L 3- , while the spectra of the other protonation equalibria disturb the position of the intersection at the isosbestic point for LH 2- /L 3- . (b) The positions of the isosbestic points are also shown in the graph of the molar absorption coefficients vs. wavelength for variously protonated Roxadustat.

  7. The strategy of wavelengths range concerns the dependence of the proximity between the ionisable group and the chromophore. The spectral shift might not be strong enough to allow a successful determination of a model of dissociation constants. The model of 3 p K a (left column) and 4 p K a (right column) estimated from the entire spectrum of wavelength A - D is compared with those estimated from three separate absorption bands, 220 – 270 nm, 260 – 320 nm, and 320 – 410 nm. The best spectra fitness s ( A ) is in the wavelength range 260 – 320 nm, although the p K a estimates were nearly the same in all three ranges. Here n means the number of pH and m is the number of wavelengths of every spectrum.

  8. The change of pH did not cause same changes in Roxadustat spectrum because some chromopho- res were only slightly affected by a pH change. (a) The spectra of molar absorption coefficients on wavelength contains positions of six wavelengths A through F at which following A- pH curves were analysed. (b) The distribution diagram of relative concentration of all variously protonated species indicated close dissociation constants. A - F: The A-pH graphs A through F demonstrate a sensitivity of chromophores in Roxadustat molecule on pH changes: the maximum absorbance shifts at pH changes in range of 2.6 – 11.6 estimating p K 1 were 100 (at position A), 140 (at B), 60 (at C), 40 (at D), 50 (at E) and 60 mAU (at F), which lead to the mean 75.0 mAU. Analogically, for an estimation of p K 2 they were 130, 100, 70, 40, 50 and 50 with the mean 73.3 mAU. For an estimation p K 3 they were 50, 120, 150, 50, 30 and 80 with the mean 80.0 mAU, and finally the largest shifts of absorbance to estimate p K 4 were 350, 240, 260, 130, 90 and 300 with the mean 228.3 mAU.

  9. The reproducibility of the dissociation constants of Roxadustat estimated from five reproduced measurements (UV-metric) and seven reproduced measurements (pH-metric) were found to be in good agreement at 25 ℃ (Table 1). The arithmetic mean of the dissociation constants with their standard deviation and a spectra-fitness was expressed as the standard deviation s ( A ) and s ( V ). Both methods found the better curve-fitness achieved with the model of four dissociation constants (REACTLAB, SQUAD84, ORIGIN 9).

  10. (a) The 2D-plot of absorbance changes in the Roxadustat 2D-spectra set were within pH-titration. (b) The set of A-pH curves at selected wavelength shows a sensitivity of chromophores in Roxadustat on the pH change. (c) The plot of the absorbance shift Δ ij in the Roxadustat spectrum within pH-titration when the value of the absorbance difference for the j th- wavelength of the i th-spectrum is expressed Δ ij = A ij – A i ,acid . This absorbance changes Δ were plotted on wavelength λ. Here A i , acid standed for the limiting spectrum of the acid form of the Roxadustat. (d) Residuals e [mAU] were tested if they were of the same magnitude as the instrumental noise s inst ( A ), (REACTLAB, ORIGIN 9).

  11. Deconvolution of the each experimental spectrum (exp) of 8.0 × 10 -5 mol. dm -3 Roxadustat at I = 0.0081 at 25 ° C into spectra of the individual variously protonated species L 3- , LH 2- , LH 2 - , LH 3 , + in mixture for pH 2.92, 3.40, 4.04, LH 4 5.47, 6.28, 8.09, 9.02 abd 9.77 using SQUAD84.

  12. The search for the protonation model with the potentiometric pH-metric method for 3 and 4 dissociation constants. The pH-titration curve of alkalized Roxadustat is titrated with HCl and plotted with the Bjerrum protonation function comparing 3 and 4 p K a . Dissociation constants were estimated with ESAB at 25 ° C (ESAB, ORIGIN).

  13. The extrapolation of the mixed dissociation constants of Roxadustat on the square root of the ionic strength for four dissociation constants leading to the thermodynamic dissociation constant p K T a at 25 ° C ( Left ) and 37 ° C ( Right ) using UV-metric technique ( Upper ) and pH-metric ( Lower ). The Working-Hotteling confidence bands express an uncertainty of the each dissociation constant: the broader band means the more uncertain p K a .

  14. Scheme 1 The protonation scheme of Roxadustat.

Download Presentation
Download Policy: The content available on the website is offered to you 'AS IS' for your personal information and use only. It cannot be commercialized, licensed, or distributed on other websites without prior consent from the author. To download a presentation, simply click this link. If you encounter any difficulties during the download process, it's possible that the publisher has removed the file from their server.

Recommend


More recommend