constants of the lesinurad
play

Constants of the Lesinurad * Milan Meloun 1 , Aneta pov 1 , Lucie - PowerPoint PPT Presentation

Multiwavelength UV-metric and pH-metric Determination of the Multiple Dissociation Constants of the Lesinurad * Milan Meloun 1 , Aneta pov 1 , Lucie Pilaov 1 , and Tom Pekrek 2 1 Department of Analytical Chemistry, University of


  1. Multiwavelength UV-metric and pH-metric Determination of the Multiple Dissociation Constants of the Lesinurad * Milan Meloun 1 , Aneta Čápová 1 , Lucie Pilařová 1 , and Tomáš Pekárek 2 1 Department of Analytical Chemistry, University of Pardubice, CZ 532 10 Pardubice, Czechia, 2 Zentiva k.s., U kabelovny 130, CZ 102 37 Prague, Czechia,

  2. Graphical abstract

  3. Abstract 
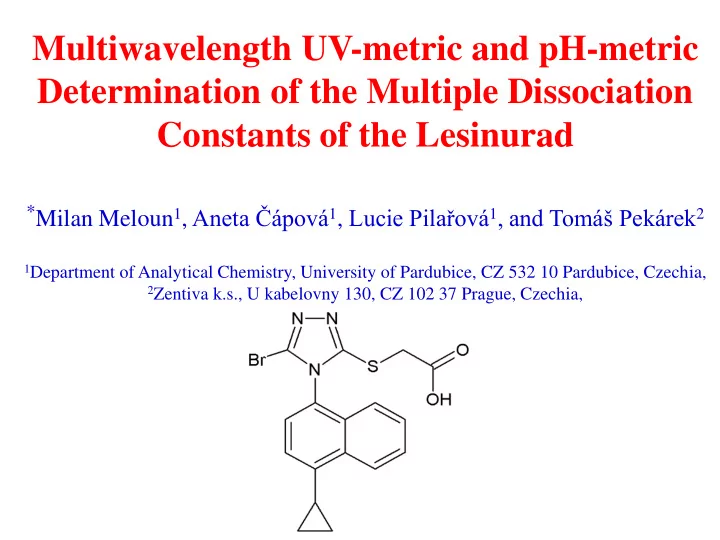
UV/VIS-metric of the selective inhibitor of uric acid reabsorption Lesinurad for three pK a were estimated p K T a1 = 2.09, p K T a2 = 4.25, p K T a3 = 6.58 at 25 ° C and p K T a3 = 6.32 at 37 ° C. a1 = 1.96, p K T a2 = 4.16, p K T A sparingly soluble anion L - was protonated to form still soluble molecule + and LH 3 2+ in pure water. and cations LH, LH 2 Three multiple thermodynamic dissociation constants of 1 × 10 -4 M Lesunirad were determined by the regression analysis of pH-metric a3 = 6.17 at 25 ° C and p K T titration curves p K T a1 = 2.39, p K T a2 = 3.47, p K T a1 a3 = 6.03 at 37 ° C. The macro-dissociation = 2.08, p K T a2 = 3.29, p K T constants were predicted with MARVIN and ACD/Percepta programs. The positive values of ΔG 0 (pK a1 ) = 11.93 kJ.mol -1 , ΔG 0 (pK a2 ) = 24.26 kJ.mol -1 , ΔG 0 (pK a3 ) = 37.56 kJ.mol -1 at 25 ° C indicate that the dissociation process of pK a2 is not spontaneous, which was confirmed by its value of entropy ΔS 0 (pK a1 )= 24.37 J.mol -1 , ΔS 0 (pK a2 ) = -36.79 J.mol -1 , ΔS 0 (pK a3 )= 2.79 J.mol -1 .

  4. Molecular structure of Lesinurad (inset) with highlighted basic centres A, B and C and predicted p K a values using MARVIN/ACD prediction programs. Structure of auxiliary fragments 1-3 and their predicted p K a .

  5. Five modifications of the Cattel’s scree plot log s k ( SV ) = f ( k ) of the of singular value decomposition SVD for the rank estimation of the absorbance matrix (the residual standard deviation RSD, the root mean error square RMS, the average error criterion AE, χ 2 criterion Chi2) lead to k * = 3 in logarithmic scale for Lesinurad. n c = 3, but one modification ( i.e., the standard deviation of eigenvalues g k ) lead to k * = 4.

  6. Typical SQUAD84 working environment searching the best protonation model of Lesinurad in the pH range from 2 to 8 for one, two and three dissociation constants p K a1 , p K a2 , p K a3 using 1.0 × 10 -4 mol. dm -3 Lesinurad at 25 ° C. Left: The pure spectra profiles of molar absorptivities vs . wavelength (nm) for all of the variously protonated species of Lesinurad. Right: The distribution diagram of the relative concentrations of all of the variously protonated species in dependence on pH, (REACTLAB).

  7. Left: The plot of the 3D-absorbance-response-matrix for Lesinurad representing the measured multiwavelength absorption spectra for Lesinurad according to pH at 25 ° C. Middle: The plot of the 2D-absorbance-response-matrix. Right: Reproducibility of the estimated dissociation constants evaluated in three absorption bands. The estimates of dissociation constants p K a 1 , p K a 2 , and p K a 3 with their standard deviation in the last two digits are written. The goodness-of-fit is expressed as the standard deviation of absorbance after the regression was performed s ( A ) [mAU], (REACTLAB).

  8. (a) The plot of small absorbance changes in the Lesinurad 2D-spectra set are within pH-titration, (b) Absorbance-pH curves are at selected wavelengths, (c) Residuals e [mAU] are divided by the instrumental standard deviation e / s inst ( A ) to test if the residuals e are of the same magnitude as the instrumental noise s inst ( A ), (d) The plot of small absorbance shift in the Lesinurad spectrum within pH-titration when the value f the absorbance difference for the j th-wavelength of the i th-spectrum Δ ij = A ij – A i ,acid is divided by the instrumental standard deviation, leading to SER = Δ ij / s inst ( A ). This SER ratio is plotted on wavelength λ. Here A i , acid is the limiting spectrum of the acid form of the Lesinurad, (REACTLAB, ORIGIN 9).

  9. Decomposition of each experimental spectrum into spectra of the individual species proves whether the experimental design has been proposed efficient enough. In pH ranges where more components contribute significantly to the spectrum, several spectra should be measured. Such a spectrum provides sufficient information for a regression analysis which monitors at least two species in equilibrium where none of them represents a minor species. Deconvolution of the each experimental spectrum of 1.0 × 10 -4 mol. dm -3 Lesinurad at I = 0.0026 at 25 ° C into spectra of the individual variously protonated species L - , LH, 2+ in mixture for pH 1.925, + , LH 3 LH 2 2.337, 4.035, 4.676, 5.692, 6.513 using SQUAD84.

  10. The search for the protonation model analysing the potentiometric titration curve of acidified Lesinurad and titrated with KOH and plotted with the Bjerrum protonation function indicating three p K a values. Dissociation constants are estimated with ESAB at 25 ° C and 37 ° C (ESAB, ORIGIN).

  11. Dependence of the mixed dissociation constants of Lesinurad on the square root of the ionic strength for three dissociation constants leading to the thermodynamic dissociation constant p K T a at 25 ° C (left) and 37 ° C (right) using UV-metric technique (S, Upper) and pH-metric (P, Lower) .

  12. The protonation diagram of the LESINURAD

  13. CONCLUSION 1) Spectrophotometric and potentiometric pH-titration allowed the measurement of three dissociation constants of Lesinurad. Chromophores of Lesinurad exhibit small changes in the UV/VIS-spectrum at the solution pH change and therefore a determination of the dissociation constants is subject to greater uncertainty than in case of a potentiometric determination. 2) The sparingly soluble anion L - of Lesinurad capable of protonation to 2+ occurs in pure water. The + , LH 3 form the still soluble three species LH, LH 2 graph of molar absorption coefficients of variously protonated species according to wavelength shows that the spectrum of species L - and LH 3 2+ are nearly the same in colour. 3) In the range of pH 2 to 8 three dissociation constants can be reliably estimated from the spectra when concentration of Lesinurad is about 1.0 × 10 - 4 mol. dm -3 . Three thermodynamic dissociation constants can be reliably determined with SQUAD84 and REACTLAB reaching the similar values a3 = 6.58 at 25 ° C and with both programs, p K T a1 = 2.09, p K T a2 = 4.25, p K T a3 = 6.32 at 37 ° C. p K T a1 = 1.96, p K T a2 = 4.16, p K T

  14. 4) Three thermodynamic dissociation constants of Lesinurad in a concentration of 3 × 10 -4 mol. dm -3 were determined by the regression analysis of potentiometric titration curves using ESAB, p K T a1 = 2.39, p K T a2 = 3.47, a3 = 6.17 at 25 ° C and p K T a3 = 6.03 at 37 ° C. p K T a1 = 2.08, p K T a2 = 3.29, p K T 5) Prediction of the p K T a of Lesinurad was performed using the MARVIN program to specify protonation locations and ACD/Percepta program. In comparing two predictive and two experimental techniques, it may be concluded that the prediction programs sometimes vary in p K a . 6) Thermodynamic parameters Δ H 0 and Δ G 0 have been determined from the temperature variation of dissociation constants estimated from spectra analysis using the van't Hoff's equation. The values of enthalpy ΔH 0 (pK a1 ) = 19.19 kJ.mol -1 , ΔH 0 (pK a2 ) = 13.29 kJ.mol -1 , ΔH 0 (pK a3 ) = 38.39 kJ.mol -1 , show the dissociation process is endothermic. The positive values of ΔG 0 (pK a1 ) = 11.93 kJ.mol -1 , ΔG 0 (pK a2 ) = 24.26 kJ.mol -1 , ΔG 0 (pK a3 ) = 37.56 kJ.mol -1 at 25 ° C indicate that the dissociation process of pK a2 is not spontaneous, which was also confirmed by its negative value of entropy ΔS 0 (pK a1 )= 24.37 J.mol -1 , ΔS 0 (pK a2 ) = -36.79 J.mol -1 , ΔS 0 (pK a3 )= 2.79 J.mol -1 .

Download Presentation
Download Policy: The content available on the website is offered to you 'AS IS' for your personal information and use only. It cannot be commercialized, licensed, or distributed on other websites without prior consent from the author. To download a presentation, simply click this link. If you encounter any difficulties during the download process, it's possible that the publisher has removed the file from their server.

Recommend


More recommend