MULTI-SCALE DEFORMATION BEHAVIOR IN HYBRID CFRP OBSERVED BY IN-SITU - - PDF document

multi scale deformation behavior in hybrid cfrp observed
SMART_READER_LITE
LIVE PREVIEW

MULTI-SCALE DEFORMATION BEHAVIOR IN HYBRID CFRP OBSERVED BY IN-SITU - - PDF document

18 TH INTERNATIONAL CONFERENCE ON COMPOSITE MATERIALS MULTI-SCALE DEFORMATION BEHAVIOR IN HYBRID CFRP OBSERVED BY IN-SITU FE-SEM Y. Tanaka 1* , K. Naito 1, S. Kishimoto 1 , Y. Kagawa 1,2 1 Hybrid Materials Center, National Institute for Materials


slide-1
SLIDE 1

18TH INTERNATIONAL CONFERENCE ON COMPOSITE MATERIALS

1 Introduction Multi-scale deformation and strain measurement is a significant for understanding the role of microstructural on macroscopic mechanical characterizations. The damage evolution and fracture initiation in hierarchical structure materials has been in general associated with the development

  • f regions of localized behaviors, some interfaces in

composite materials, defects and inclusions, and

  • ther microstructural inhomogeneity at different

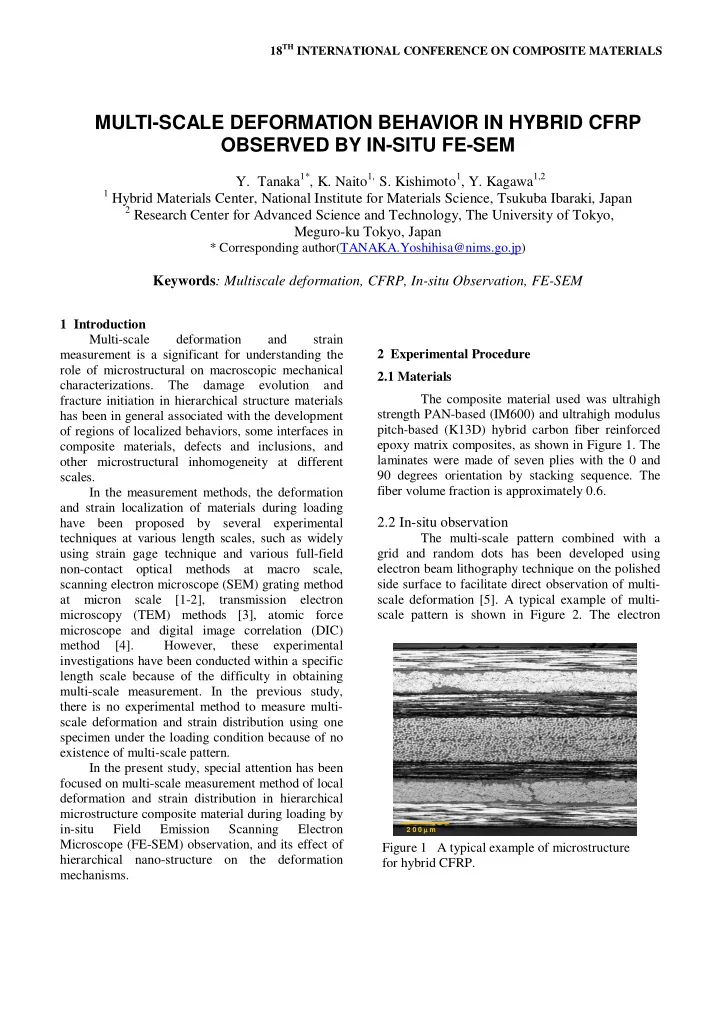
scales. In the measurement methods, the deformation and strain localization of materials during loading have been proposed by several experimental techniques at various length scales, such as widely using strain gage technique and various full-field non-contact optical methods at macro scale, scanning electron microscope (SEM) grating method at micron scale [1-2], transmission electron microscopy (TEM) methods [3], atomic force microscope and digital image correlation (DIC) method [4]. However, these experimental investigations have been conducted within a specific length scale because of the difficulty in obtaining multi-scale measurement. In the previous study, there is no experimental method to measure multi- scale deformation and strain distribution using one specimen under the loading condition because of no existence of multi-scale pattern. In the present study, special attention has been focused on multi-scale measurement method of local deformation and strain distribution in hierarchical microstructure composite material during loading by in-situ Field Emission Scanning Electron Microscope (FE-SEM) observation, and its effect of hierarchical nano-structure on the deformation mechanisms. 2 Experimental Procedure 2.1 Materials The composite material used was ultrahigh strength PAN-based (IM600) and ultrahigh modulus pitch-based (K13D) hybrid carbon fiber reinforced epoxy matrix composites, as shown in Figure 1. The laminates were made of seven plies with the 0 and 90 degrees orientation by stacking sequence. The fiber volume fraction is approximately 0.6.

2.2 In-situ observation

The multi-scale pattern combined with a grid and random dots has been developed using electron beam lithography technique on the polished side surface to facilitate direct observation of multi- scale deformation [5]. A typical example of multi- scale pattern is shown in Figure 2. The electron

MULTI-SCALE DEFORMATION BEHAVIOR IN HYBRID CFRP OBSERVED BY IN-SITU FE-SEM

  • Y. Tanaka1*, K. Naito1, S. Kishimoto1, Y. Kagawa1,2

1 Hybrid Materials Center, National Institute for Materials Science, Tsukuba Ibaraki, Japan

2 Research Center for Advanced Science and Technology, The University of Tokyo, Meguro-ku Tokyo, Japan

* Corresponding author(TANAKA.Yoshihisa@nims.go.jp)

Keywords: Multiscale deformation, CFRP, In-situ Observation, FE-SEM

2 0 0 m

Figure 1 A typical example of microstructure for hybrid CFRP.

slide-2
SLIDE 2

moiré method was applied to measure the deformation and strain distribution in the deformed specimens at laminate scale and DIC method was applied to measure the localized deformation such as the interface between the fiber and the matrix at a micron and nano meter scale obtained before and after loading. The DIC method has some advantages, compared with the interferometric optical method, such as simple experimental set up and specimen preparation and wide range of spatial resolution. The digital images can be obtained by various equipments at high resolution, such as atomic force microscopy (AFM), scanning electron microscopy (SEM) and scanning tunneling microscopy (STM). However, the object specimen surface must have a random pattern with high quality image to realize micro and nano-scale deformation measurement. FE-SEM observations can be clearly distinguished the multi-scale pattern at different scales by using Back Scattered Electron detector. In order to measure multi-scale deformation, 3-points flexure test was performed. A special loading device was built to fit in the FE-SEM (Quanta 200 FEG, FEI Corp.), as shown in Figure 3. Prior to in-situ 3-point flexure testing, a side surface

  • f the specimen was polished and the multi-scale

pattern was fabricated onto the surface near the loading point. A strain gauge was mounted on the

  • pposite side (tensile face) of the loading point to
  • btain the tensile strain during flexure loading. The

loading was stopped after a predetermined amount

  • f strain increment to allow in-situ observation. The

image data has 1,024 884 with 8-bit value intensity. 3 Results and discussions Macroscopic deformation behaviors are

  • bserved by electron moiré method and digital

image correlation method at the different length scales, as shown in Figure 4. The electron moiré fringe patterns are clearly generated in the region of multi-scale pattern at the magnification of 116 (Figure 4(a)). These fringe patterns are almost straight before deformation. With increasing bending deformation, the moiré fringes are distorted from the original fringes, and then the distorted angle has the maximum at the tip and its decreases with distance from the loading tip. Especially, delamination is clearly observed at the laminate interface, indicated by arrow in Figure 4(a). The moire pattern was changed after the delamination caused by the shear deformation. Figure 4(b) and (c) show the displacement in the loading direction, analyzed by Digital Image Correlation method,

  • bserved

at different magnifications. The deformation behavior seems to be homogeneous at macro-scale observation. However, inhomogeneous deformation behavior appears in the IM600 90 degrees laminate due to the effect of microstructures. The amount of the deformation values in the

(a) (b) (c)

50m

Figure 2 A typical example of multi-scale pattern consisting of (a) grid, (b) random pattern at the magnification of the boxed region in (a), and (c) nano pattern at the magnification of the boxed region in (b). Figure 3 Experimental setup for in-situ FE-SEM

  • bservation.
slide-3
SLIDE 3

3 PAPER TITLE

measured areas are decreased with increasing the magnification. Figure 5 shows the equivalent strain contour map at an applied strain of 0.0035 and the averaged equivalent strain as a function of the distance from the loading point at different strains. The averaged strain decreases with distance from the loading point due to flexure deformation. Especially, inhomogeneous strain appears at the laminates

  • interface. It seems to be possible to become fracture

initiation site at the laminates interface. It is suggested that the result from DIC analysis agrees well with delamination behavior at the laminates interface. Figure 6 shows displacement in the direction of x (same region in Figure 4(c)) and shear strain contour map with direction of principal strain of the boxed region in Figure 5(a). The white dotted line indicates the fiber/matrix interface. Localized deformation behavior appears in the epoxy matrix region and it differs with different location, as indicated by allow. The localized hear plastic strain is clearly formed in the matrix closed to the fiber/matrix interface and direction of shear is strong dependent on the fiber distribution. The maximum principal strain is produced in the direction about 45 degree to the fiber. The maximum shear stress is approximately 10 times larger than the applied tensile strain. It is suggested that the microscopic fracture initiation seem to occur easier at the fiber/matrix interface. Figure 7 shows the displacement in the direction of x and y, and the shear strain contour map located at the interface between IM600 90 degree and K13D degree laminate. Inhomogeneous deformation is clearly formed at the interface due to the elastic modulus differences between laminates. The localized shear strain appears in the laminate interface. This result shows that the localized plastic strain at the microscopic

0.5mm Delamination (a) (b) (c) 3-point loading tip

Figure 4 Multiscale deformation behaviors in the loading direction at applied strain of 0.005: (a) observed by electron moire method, (b) displacement at magnification of 1,000 analyzed by DIC method of the boxed region in (a), (c) the magnification of 30,000 of the boxed region in (b). Figure 5 (a): the equivalent strain contour map at an applied strain of 0.0035, (b): the averaged equivalent strain of as a function of distance from the loading point under different applied strain.

slide-4
SLIDE 4

scale agree with macroscopic strain distribution. 4 Conclusions The developed multiscale pattern is applied to measure in-plane multiscale deformation and strain distribution in a hierarchical microstructured carbon fiber-reinforced composite by using in situ FE-SEM observations. The present study provides deformation behaviors at multiple length scales and their related boundary conditions such as interface debonding and sliding, damage initiation and evolution, and deformation gradients needed for developing gradient continuum plasticity at different length scales for understanding hierarchical composite materials. References

[1] L. Allais, M. Bornert, T. Bretheau, D.

Caldemaison, “Experimental characterization of the local strain field in a heterogeneous elastoplastic material”, Acta Metall. Mater. Vol. 43, pp. 3865-3880, 1994.

[2] H.A. Crostack, G. Fischer, E. Soppa, S.

Schmauder, Y.L. Liu, “Localization of strain in metal matrix composites studied by a scanning electron microscope-based grating method”, J. Microscopy, Vol. 201, pp. 171-178, 2001.

[3] T. Saito, T. Hirayama, T. Yamamoto, Y. Ikuhara,

“Lattice Strain and Dislocations in Polished Surface on Sapphire”, J. Am. Ceram. Soc., Vol. 88, pp. 2277-2285, 2005.

[4] B. Pan, K. Qian, H. Xie, A. Asundi, “Two-

dimensional digital image correlation for in- plane displacement and strain measurement: a review”, Meas. Sci. Technol., Vol. 20, pp. 1-17, 2009.

[5] Y. Tanaka, K. Naito, S. Kishimoto and Y.

Kagawa, “Development of a pattern to measure multiscale deformation and strain distribution via in situ FE-SEM

  • bservations”,

Nanotechnology, Vol. 22, pp. 115704, 2011. Figure 6 (b): displacement in the direction of x at magnification of 30,000, (b): shear strain distribution with the principal strain direction of the boxed region in (a). Figre 7 Displacement and strain contour map at the laminate interface between IM600 90 degree and K13D 0 degree, (a) direction of y, (b) direction of x, (c) shear strain distribution.