
SLIDE 1
Multi-Act Equity Consultancy Pvt. Ltd.
10th floor, The Ruby Tower, 29 Senapati Bapat Marg, Dadar (W), Mumbai- 400028, Tel +9122 61408989 www.multi-act.com Page 1 of 7 Prepared for Restricted Circulation
- Regd. Office: 3rd Floor, Trade Centre, North Main Road, Koregaon Park, Pune – 411001, Tel. +91 20 66033141/2, www.multi-act.com
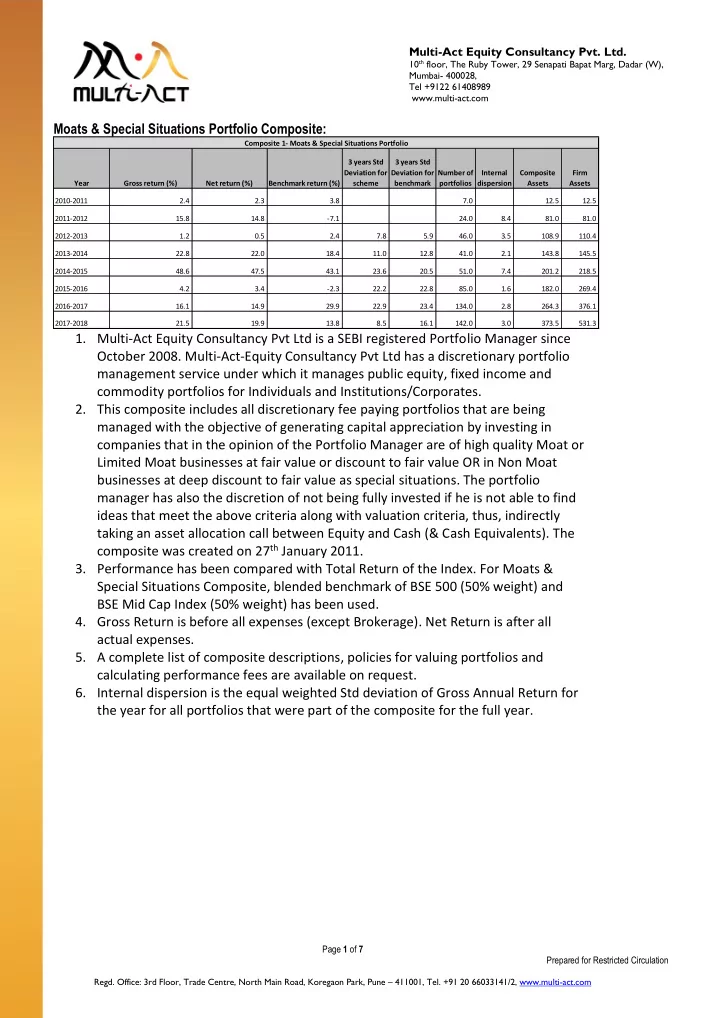
Moats & Special Situations Portfolio Composite:
- 1. Multi-Act Equity Consultancy Pvt Ltd is a SEBI registered Portfolio Manager since
October 2008. Multi-Act-Equity Consultancy Pvt Ltd has a discretionary portfolio management service under which it manages public equity, fixed income and commodity portfolios for Individuals and Institutions/Corporates.
- 2. This composite includes all discretionary fee paying portfolios that are being
managed with the objective of generating capital appreciation by investing in companies that in the opinion of the Portfolio Manager are of high quality Moat or Limited Moat businesses at fair value or discount to fair value OR in Non Moat businesses at deep discount to fair value as special situations. The portfolio manager has also the discretion of not being fully invested if he is not able to find ideas that meet the above criteria along with valuation criteria, thus, indirectly taking an asset allocation call between Equity and Cash (& Cash Equivalents). The composite was created on 27th January 2011.
- 3. Performance has been compared with Total Return of the Index. For Moats &
Special Situations Composite, blended benchmark of BSE 500 (50% weight) and BSE Mid Cap Index (50% weight) has been used.
- 4. Gross Return is before all expenses (except Brokerage). Net Return is after all
actual expenses.
- 5. A complete list of composite descriptions, policies for valuing portfolios and
calculating performance fees are available on request.
- 6. Internal dispersion is the equal weighted Std deviation of Gross Annual Return for
the year for all portfolios that were part of the composite for the full year.
Year Gross return (%) Net return (%) Benchmark return (%) 3 years Std Deviation for scheme 3 years Std Deviation for benchmark Number of portfolios Internal dispersion Composite Assets Firm Assets 2010-2011 2.4 2.3 3.8 7.0 12.5 12.5 2011-2012 15.8 14.8
- 7.1
24.0 8.4 81.0 81.0 2012-2013 1.2 0.5 2.4 7.8 5.9 46.0 3.5 108.9 110.4 2013-2014 22.8 22.0 18.4 11.0 12.8 41.0 2.1 143.8 145.5 2014-2015 48.6 47.5 43.1 23.6 20.5 51.0 7.4 201.2 218.5 2015-2016 4.2 3.4
- 2.3