
SLIDE 1
FAC Presentation 2/12/2020 2/11/2020 1
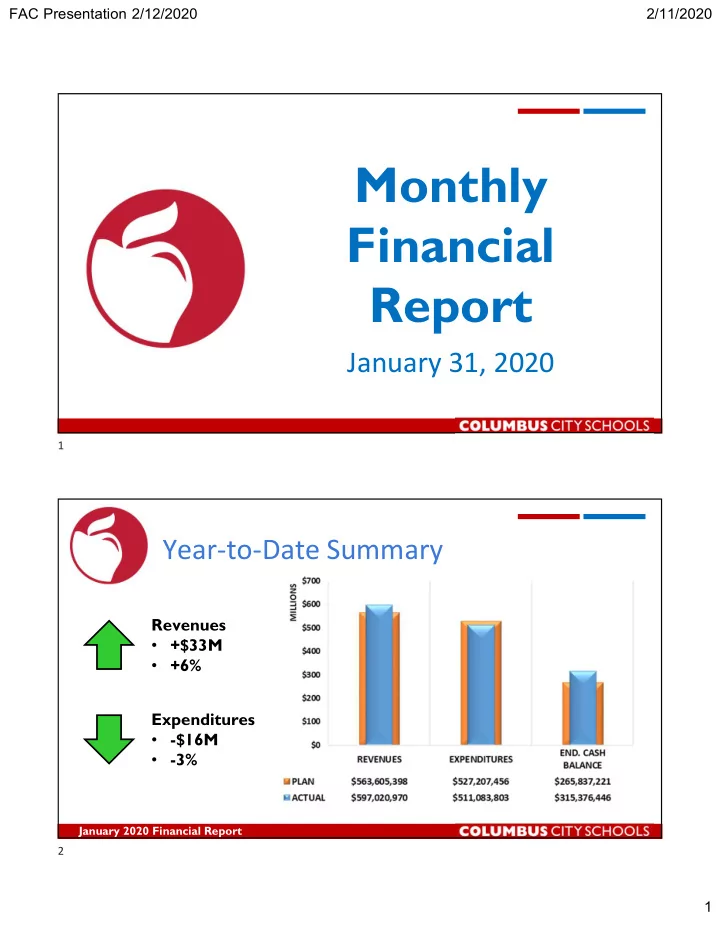
Monthly Financial Report
January 31, 2020 Year-to-Date Summary
Revenues
- +$33M
- +6%
Expenditures
- -$16M
- -3%
January 2020 Financial Report 1 2
Monthly Financial Report January 31, 2020 1 Year-to-Date Summary - - PDF document
FAC Presentation 2/12/2020 2/11/2020 Monthly Financial Report January 31, 2020 1 Year-to-Date Summary Revenues +$33M +6% Expenditures -$16M -3% January 2020 Financial Report 2 1 FAC Presentation 2/12/2020 2/11/2020
FAC Presentation 2/12/2020 2/11/2020 1
Revenues
Expenditures
January 2020 Financial Report 1 2
FAC Presentation 2/12/2020 2/11/2020 2
Settlement Expected 1st Week of March
+$3.6 million for the month +$9.6 million YTD (Investment income +$4.7M, PILOTs +$2.9M)
January 2020 Financial Report
January 2020 Financial Report 4 5
FAC Presentation 2/12/2020 2/11/2020 3
January 2020 Financial Report
January 2020 Financial Report 6 7
FAC Presentation 2/12/2020 2/11/2020 4
January 2020 Financial Report
Source Variance amount Variance Percentage Percent of Total
Property Taxes High* High* 54.5% State Aid High Low 38.6%
Low Low 0.1% Property Tax Allocation Low High 3.2% All Other Revenues High High 2.4% Other Financing Sources Low High 1.3%
“High”: Variance amount >= $5 million OR Variance percentage >= 5%
Salaries & Wages: $1.9M under, 0.8% Benefits: $3.1M under, 3.0%
Under plan every month this fiscal year $8.6M under, 5.6%, overall
All other purchased services: $7.6M under, 21%
January 2020 Financial Report 8 9
FAC Presentation 2/12/2020 2/11/2020 5
January 2020 Financial Report
January 2020 Financial Report 10 11
FAC Presentation 2/12/2020 2/11/2020 6
January 2020 Financial Report
January 2020 Financial Report
Source Variance amount Variance Percentage Percent of Total Budget Personnel High* Low 64.8% Purchased Services High High 8.2% Charter Low Low 22.2% Supplies Low Low 2.3% Capital Outlay Low High 0.5% Debt Low Low 0.4% Other Objects Low High 1.1% Other Uses Low High 0.4%
“High”: Variance amount >= $5 million OR Variance percentage >= 5%
12 13