
SLIDE 1
Tomsk, 2015
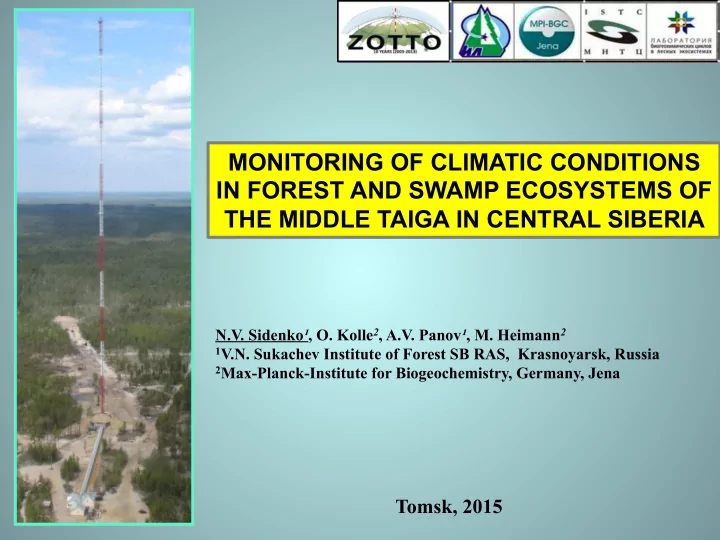
MONITORING OF CLIMATIC CONDITIONS IN FOREST AND SWAMP ECOSYSTEMS OF THE MIDDLE TAIGA IN CENTRAL SIBERIA
N.V. Sidenko¹, O. Kolle2, A.V. Panov¹, M. Heimann2
1V.N. Sukachev Institute of Forest SB RAS, Krasnoyarsk, Russia 2Max-Planck-Institute for Biogeochemistry, Germany, Jena