
SLIDE 1
C o r p o r a t e P r e s e n t a t i o n
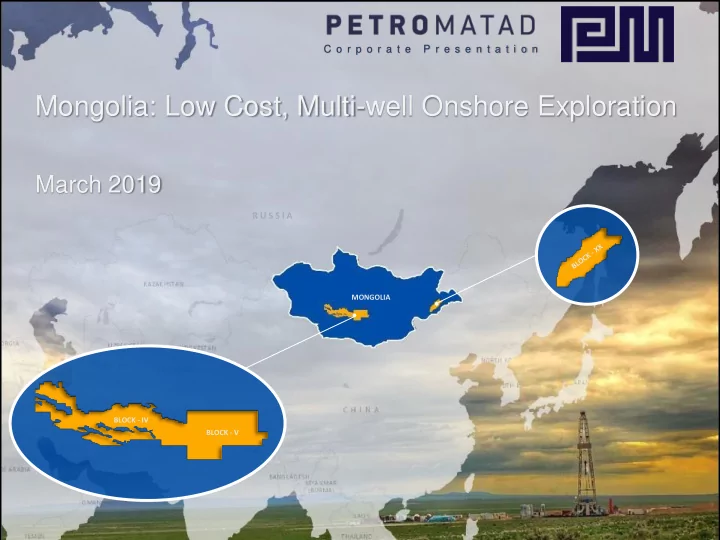
MONGOLIA BLOCK - V BLOCK - IV
Mongolia: Low Cost, Multi-well Onshore Exploration
March 2019
R U S S I A
Mongolia: Low Cost, Multi-well Onshore Exploration March 2019 R U S - - PowerPoint PPT Presentation
C o r p o r a t e P r e s e n t a t i o n Mongolia: Low Cost, Multi-well Onshore Exploration March 2019 R U S S I A MONGOLIA BLOCK - IV BLOCK - V Disclaimer This presentation has been prepared by Petro Matad Limited (the Company) and is for
C o r p o r a t e P r e s e n t a t i o n
MONGOLIA BLOCK - V BLOCK - IV
R U S S I A
This presentation has been prepared by Petro Matad Limited (the Company) and is for information purposes only. Some statements contained in this presentation or in documents referred to in it are or may be forward-looking statements. Such statements reflect the Company’s current views with respect to future events and are subject to risks, assumptions, uncertainties and
Although the Company believes that such forward-looking statements, which speak only as of the date of this presentation, are reasonable, no assurance can be given that they will prove to be correct. Actual results may differ from those expressed in such statements, depending on a variety of reasons. Therefore, you should not place undue reliance on these statements. There can be no assurance that the results and events contemplated by the forward-looking statements contained in this presentation will, in fact, occur. The Company will not undertake any obligation to release publicly any revisions to these forward-looking statements to reflect events, circumstances or unanticipated events occurring after the date of this presentation, except as required by law or by any appropriate regulatory authority. Nothing in this presentation should be considered as a profit forecast. Past performance of the Company or its shares cannot be relied on as a guide to future performance. This presentation does not constitute, or form part of or contain any invitation or offer to any person to underwrite, subscribe for,
it, form the basis of or be relied on in connection with or act as an inducement to enter into any contract or commitment therefore. This presentation does not constitute a recommendation regarding the securities of the Company. No representation or warranty (expressed or implied) is made as to, and no reliance may be placed for any purpose whatsoever on the information including projections, estimates, targets and opinions contained in this presentation or on its completeness and no liability whatsoever is accepted as to any errors, omissions, misstatements contained herein. Accordingly, neither the Company nor any of its subsidiaries and its and their officers or employees accepts any liability whatsoever arising directly or indirectly for any loss howsoever arising from the use of this presentation or its contents or otherwise in connection therewith for any purpose. In particular, this presentation and the information contained herein do not constitute an offer of securities for sale in the United
Securities Act) and may not be offered or sold in the United States other than pursuant to an exemption from, or in a transaction not subject to, the registration requirements of the Securities Act. This presentation has been prepared in compliance with English law and English courts will have exclusive jurisdiction over any disputes arising from or connected with this presentation.
2
3
▪ London, AIM Listed (MATD), Mongolia focused ▪ Experienced Board and Management Team
▪ Large acreage position held, 3 blocks in Mongolia, 100% working interest, >60,000 km2
▪ $35MM capital raising in 2018 to fund a 6 well onshore exploration programme in 2018/2019 ▪ 2 wildcat wells drilled so far, one with encouraging shows of oil and gas. Post-well analyses underway ▪ 2019 4 well programme targeting 286 MMbo Mean prospective recoverable resources ▪ Drilling to start in Q2’19 with 3 wells in Block XX including near field exploration and appraisal wells adjacent to producing fields
▪ 4th well in Block V to target prospect with 200 MMbo+ resource potential in high-graded basin. Technical work underway to rank targets and confirm drilling location
▪ All resource numbers quoted are based on Company’s internal estimates
4
▪ Stable Central Asian democracy after 70 years as a Soviet satellite ▪ Very little petroleum exploration activity in Mongolia in 20th Century due to previous geopolitical constraints despite having numerous prospective basins adjacent, and geologically similar, to prolific oil producing basins in China ▪ Produces 17,000 barrels of oil/day (2018) from fields close to Chinese border including from Blocks XIX and XXI adjacent to Petro Matad’s Block XX ▪ Exports 100% of produced crude to China at a price benchmarked to globally traded crude ▪ Pays a high price for refined products from Russia which has a monopoly on supply ▪ Energy independence a priority for the government. Work has commenced on a 30,000 bopd refinery and the search for new reserves to fill it has been prioritised Exploration Term 12 to 14 years Exploitation Term 35 Years (25+5+5) Royalty 5 to 8% Corporate tax 0% Contractor Profit Oil share 45 to 60% Gross contractor take
At Attr tract activ ive e Fi Fiscal scal Ter erms ms – in the in the top 5 of top 5 of mos most a t attr ttractiv active e Af African/ rican/As Asian ian PSC ter C terms ms
5 ▪ The Cretaceous Play and the exploration potential of the East Gobi Basin, Mongolia. 2015, Qin Et al. ▪ Analysis of the distribution of onshore sedimentary basins and hydrocarbon potential in China. 2015. Jiang Z. Et Al ▪ Tellus Database Contract: ca 2012, CGG Robertson’s www.cgg.com.
References
Songliao Basin 20 Bbbls Rec Ordos Basin 13 Bbbls Rec Tarim Basin 14 Bbbls Rec Junggar Basin 10 Bbbls Rec Bohai Basin 40 Bbbls Rec Qaidam Basin 2 Bbbls Rec Hilar-Tamsag Basin 0.5 Bbbls Rec
Erlian Basin 0.62 Bbbls Rec Turpan Basin 0.5 Bbbls Rec
East Gobi Basin 0.05 Bbbls Rec
Santanghu Basin 0.5 Bbbls Rec
Recent Discovery
Quilan Basin Productive, No Data
PETRO MATAD Proven Petroleum Systems
Yingen Basin Productive, No Data
Recent Discovery
Mongolia China
Oil in shallow boreholes
Recent Discovery
Russia Kazakhstan
Petro Matad acreage
6
XX Seismic Reprocessing Re-interpretation/mapping Drilling Location Definition Permitting/Contracting Heron-1 Gazelle-1 Red Deer-1 V Snow Leopard -1 Drilling Post-Well Studies Re-interpretation/mapping Drilling Location Definition Permitting/Contracting Well 4 IV Wild Horse -1 Drilling Post-Well Studies
Wells
Activity Block 2019 Q1 Q2 Q3 Q4 2018 Q3 Q4
J A S O N M D J F M A D J J A S O N
7
8
Aer Sag Bayindulan Sag Abei-Anan Sag Wuliyashitai Sag Oil Fields Block XIX Tonson-Uul Oilfields (~8500 bopd)
40km
Red Deer Gazelle Antelope Heron
Hilar- Tamsag Basin Erlian Basin Block XX
9
* All resource numbers quoted are based on Company’s internal estimates and published data * MMbo values are STOOIP in Blk XIX Block XIX Tonson-Uul Oilfields
Block XX Block XIX
19-12
Major Road Production Hub 19-80 (70 MMbo) 19-124
Antelope
19-121
Block XX
19-30 (3 MMbo) 19-57 19-51 19-26 (Total Complex
19-46 (15 MMbo) 19-28 19-62/99 (50 MMbo)
Heron Gazelle
19-46-3 19-46-1
Block XIX Block XX
10 *Source: Mongolia Oil Shale Conference 2014: Petro China presentation
❑ Mapping and available well data indicate 19-46 field, 19-46-1 and 19-46-3 discoveries are part of the same oil accumulation ❑ 19-46-1/3 structure clearly extends up-dip into Block XX. Heron well located to appraise the structure
Lines of sections slides 12 and 13
Petro China Top Tsagaanstav Map *
11
❑ Revised mapping following seismic reprocessing clearly shows 19-46-3 discovery extends into Block XX ❑ Larger trap area of Heron Prospect confirmed by revised mapping ❑ Commercial flow rates achieved in ‘19-46 Area’ wells ❑ Total STOOIP of Heron Prospect increased to 157 MMbo ❑ Adjacent infrastructure facilitates quick development in the event of success
▪ All resource numbers quoted are based on Company’s internal estimates
Mean P90 P50 P10 25 11 23 42 Prospective Resource Estimate in MMbo
Heron-1
TWT
12
❑ Revised mapping following seismic reprocessing confirms trap configuration and resource potential ❑ Located immediately up-dip of proven oil and ideally placed capture migration from kitchen to the northeast ❑ Structural configuration the same as 19-30 Oilfield on strike to North which is PetroChina’s best producing
❑ Adjacent infrastructure facilitates quick development in the event of success
NW SE
Line 07-20-36
TWT
Gazelle-1
Upper Zuunbayan Fm Lower Zuunbayan Fm Late Cretaceous and younger Tsagaantsav Fm Basement
TD c. 2100m m TVD
Mean P90 P50 P10 13 6 12 22 Prospective Resource Estimate in MMbo
▪ All resource numbers quoted are based on Company’s internal estimates
13
❑ New basin opening well in Asgat Sag, 100km southwest of existing production ❑ Targeting Early Cretaceous Petroleum System proven in surrounding basins ❑ Outcrop and shallow borehole data confirm presence of oil prone source rocks ❑ Basin centre 3-way dip fault bounded closure ❑ Attractive resource size with significant follow up potential Red Deer-1
Mean P90 P50 P10 48 20 43 82 Prospective Resource Estimate in MMbo
▪ All resource numbers quoted are based on Company’s internal estimates
Line 11-20-22
1km NW SE
Basement
TWT
14 ▪ All economics based on Company’s internal estimates and using data available from neighbouring operations ▪ Economics run at Dec ‘18 Brent Forward Curve prices: 2019 $57.13, 2020 $57.60, 2021 $57.99, 2022 $58.58, 2023 $59.28, 2024 $59.90, 2025 $60.56, 2026+ 2% Esc
▪ 5% crude differential discount to Brent prices assumed based on pricing of adjacent production ▪ 50 MMbo case assumes own production facilities are constructed ▪ 15 MMbo case assumes minimal facilities (pumps and tanks) and export via truck to Block XIX facilities ▪ Trucking costs $9/bbl based on Petro China operation (cost recoverable as operating expense) ▪ Maximum capex exposure of $45MM for the 15MMbo case and c.$100MM for the 50MMbo case ▪ Well by well development offers a low capex alternative to bring fields close to infrastructure on stream immediately Case 15 MMBO 50 MMBO NPV10 ($MM) 76 299 IRR % 37 39 Sensitivities (NPV10 $MM) Oil price +10%/-10% 108/48 402/205 Costs -10%/+10% 97/54 364/228 Production +10%/-10% 108/48 402/205
2,000 4,000 6,000 8,000 10,000 12,000 14,000 16,000 18,000 2019 2021 2023 2025 2027 2029 2031 2033 2035 2037 2039 2041 2043 2045
BOPD
Gross Production
50 MMBO 15 MMBO (100) (80) (60) (40) (20) 20 40 60 80 100 120 2019 2021 2023 2025 2027 2029 2031 2033 2035 2037 2039 2041 2043
$Millions
Contractor Net Cash Flow
50 MMBO 15 MMBO
15
2018 Taats Basin Opener, Snow Leopard-1
16
Prospects Leads 3D Seismic 2D Seismic
Taats Basin Tugrug Basin
100 km 50 25 40 km 20 10 20 km 10 5
100 200 300 400 500 600 700 800 900 1000 1100 1200 1300 1400 1500 1600 1700 1800 1900 2000 2100 2200 2300 2400 2500 2600 2700 2800 2900 3000 1 10 100 1000 10000 100000 C1 C2 C3 iC4 nC4 iC5 nC5
17
LITH
Top Mkr 2 (?Undur Fm) 1285 52 Top Basement 2867
TD 2930
3100 3200 Oil sheen on mud at 1415m but no sand or show 600 1900 Top Shinehudug Formation 793 Top Sharilyn Formation 2439 9 5/8" Csg 2084m 1400 1100 From 1815m Shale a/a and Shale - dark brown to dark grey with pyrite - likely fault 1500 Predominantly dark grey shale with fine grained sandstone stringers. No shows. 1600 1700 1800 2000 1200 1300 300 1000 500 900 2900 3000 3300 2200 2300 2400 2500 2600 2700 2800 ACTUAL
Depth m MD
CSG WLL 20" Cond 21m 700 800 400 Depth m 200 MD KBE TVD SS 13 3/8" Csg 542.5m SP-SGR-DLL-MSFL-DTL / GR-NEU-DEN / VSP 2100 GR TO SURFACE 100 Top Huhteeg Formation 310 1027 544 SP-SGR-DLL-MSFL-DTL / GR-NEU- DEN / VSP
Drilling Component Gases (ppm)
▪ Gases to C5 from 1100m encouraging for source rock development ▪ Oil in mud at 1415m confirmed as migrated light oil from a mature source rock ▪ Striped seismic signature below MKR2 level associated with high organic content of claystones rather than with hoped for reservoir development ▪ Good sand development in deeper Sharilyn Fm target but no shows observed ▪ Granite basement slightly shallower than prognosed Initial post-well evaluation: ▪ Age dating confirms Late Jurassic/Early Cretaceous proven play ▪ Thick sequence of source rocks developed. Early mature in well, peak mature in basin centre ▪ Active Petroleum System present ▪ Lack of sand in Undur Fm and trap failure (Sharilyn Fm may be too sandy for fault seal) likely reasons for absence of oil accumulation
Well Summary
18
Snow Leopard-1
Projected 2km West
Velociraptor
Top Mkr-2
SW NE
Mid Cretaceous Unconformity
Source rocks
Top Sharilyn Fm
Line 16-5-22
❑ 4-way dip closure over thick depocentre ❑ Source intervals seen in SL-1 thicken into depocentre, short vertical migration pathways into Raptor Trend ❑ Shallow, good quality, sandstone reservoirs seen in SL-1. sourced from basin bounding fault scarp - Raptor Trend well located for thick reservoir units ❑ Requires only a shallow well to test largest closure at Velociraptor with 201 MMbo potential ❑ Multiple upside potential on Raptor Trend (~400 MMbo) and in Taats and Tugrug Basins
TD c. 1500m m TVD
Oil in mud Reservoir rocks
Mean P90 P50 P10 201 112 185 312 Prospective Resource Estimate in MMbo
▪ All resource numbers quoted are based on Company’s internal estimates
Basement TWT
19
❑ Basin centre 3-way dip fault closure with multiple targets, 206 MMbo mean resource potential ❑ Oil shows in TSC-1 core 8km northwest prove active petroleum system in the basin ❑ Basin margin follow on potential being evaluated ❑ Additional stratigraphic upside potential mapped
Mean P90 P50 P10 206 123 188 325 Prospective Resource Estimate in MMbo
▪ All resource numbers quoted are based on Company’s internal estimates SW NE
Fox-1
1km
Basement
TWT
3D arbitrary line
20
▪ Early production via trucking to Chinese refineries ▪ Reserves would justify pipeline and will further support development/upgrade of domestic refining capacity ▪ 5% crude differential discount to Brent prices assumed ▪ Operating costs estimated at $11.50/bbl
NPV10 ($MM) 1297 IRR % 119 Sensitivities (NPV10 $MM) Oil price +10%/-10% 1,528/1,078 Costs -10%/+10% 1,385/1,192 Production +10%/-10% 1,522/1,083 Block V - 150 MMBO Recoverable Case
▪ All economics based on Company’s internal estimates ▪ Economics run at Dec ‘18 Brent Forward Curve prices: 2019 $57.13, 2020 $57.60, 2021 $57.99, 2022 $58.58, 2023 $59.28, 2024 $59.90, 2025 $60.56, 2026+ 2% Esc
21
▪ Fully funded for remaining 4 wells of 6 well drilling programme 2018/19 ▪ Portfolio balanced between near field exploration/appraisal and high impact prospects with drilling to start in Q2 2019 and rig contracting nearing completion 2019 Programme – Block XX ▪ 3 wells planned in Block XX, two of which are in a proven, producing basin ▪ Heron-1 will appraise a structure already proven productive on adjacent Block XIX and is located c.1km from the closest oil well ▪ Cumulative Prospective Resource of 86 MMbo recoverable targeted. Success case economics show potential for significant value creation ▪ Nearby infrastructure has spare capacity for processing and export allowing for early test production and rapid commercial development Block V ▪ Prospect selection in Block V under evaluation incorporating the encouraging results of Snow Leopard 1 ▪ Two prospects (Fox and Velociraptor) each with c. 200 MMbo potential in basins with proven petroleum systems Overall ▪ Excellent success case economics for all targets. Proven export route, pricing and market in China with a domestic market developing in Mongolia through refinery construction
▪ All resource numbers quoted are based on Company’s internal estimates
22
23
Non-Executive Chair-person: Enkhmaa Davaanyam
▪ 20 years of energy, mining and infrastructure project management ▪ CEO of Petrovis Group, Mongolia’s largest fuel importation and distribution company
Chief Executive Officer: Mike Buck
▪ 38 years of international E&P experience including 9 years as COO of Salamander Energy ▪ Proven track record of exploration success in S. America, N. Africa and Asia. Directly involved in the discovery of more than one billion barrels of recoverable reserves ▪ Managed major development projects in Libya, Pakistan and Iran
Chief Financial Officer: John Henriksen
▪ 40 years of upstream E&P experience in Canada, UK, Southeast Asia, Central Asia ▪ 5 years in Mongolia with Petro Matad
Non-Executive Director: Shinezaya Batbold
▪ CEO of Petrovis Venture Capital LLC ▪ Currently holds a number of board and chair positions in diversified business sectors in Mongolia
Non-Executive Director: Tim Bushell
▪ 35 years of international E&P experience including 10 years as CEO of Falklands Oil and Gas Ltd ▪ Directly involved in the discovery of more than 700 million barrels of recoverable reserves in S Atlantic and Norway
24
Truck Road 1 1
Empire Gas Mongolia LLC 1 well 2016 Gladwell Uvs Pet LLC 2 wells 2014/15 Shaman Resources LLC 2 wells 2011-12 NPI LLC 5 wells 2016/17 2 tested oil MAKS Group 2 wells 2017/18 One discovery PetroMatad 3D seismic 2017 1 well 2018 Snow Leopard-1 PetroChina Blocks XIX & XXI Production Dong Shen Block 97 Production Zong Heng You Tan LLC 14 wells 2010/12 3 tested oil 3D seismic 2014 In test production PetroMatad 2D seismic 2017 1 well 2018 Wild Horse-1
25
2018 Baatsagaan Basin Opener, Wild Horse-1
26
Drilling Component Gases (ppm) Well Summary
GLE (above MSL):1350.8m LITH
TH M MD
PROGNOSIS CSG WLL GR TO SURFACE
100
13 3/8" Cond 41m 9 5/8" Csg" 537.4m
800
1137 m TVDGL TVD SS
200 300 400 500
Top Huhteeg Fm 214
600 900 1000 1300 1400 1500
628 723 Base Upper Cretaceous Unconf
700 1100
680
1200 1600
Granite Basement Lower Undur Fm
1700
140 Top Sharilyn Fm 1490
Final TD SP-SGR-DLL-MSFL-DTL / GR-NEU-DEN / VSP 671 1211 1440
100 200 300 400 500 600 700 800 900 1000 1100 1200 1300 1400 1500 1 10 100 1000 10000 C1 C2 C3 iC4 nC4 iC5
▪ Sand development below unconformity with best drilling gas levels and to C4 across this interval ▪ Prospectivity of this interval will be evaluated on the basin margins ▪ Sands below 1200m well developed ▪ Coarser, conglomeratic sandstone below 1400m within an overall sandy package ▪ Granite basement encountered at 1440m MD significantly shallower than prognosis ▪ Oil extract obtained from sample at base of well Initial post-well evaluation: ▪ Base Upper Cretaceous unconformity is a regional seal ▪ Thermogenic gases migration along unconformity ▪ Target interval has had significant burial prior to uplift ▪ Sediments under the unconformity provisionally dated as Early to Mid Jurassic - older than prognosed ▪ Oil extract hints at source rocks presence in basin
Oil extract from cuttings
27
Prospects Leads 2D Seismic
Biger Basin Baatsagaan Basin
200 km 100 50 10 20 40 km 50 km 25 12.5