MOL2NET, 2017 , 3, doi:10.3390/mol2net-03-xxxx 2 Introduction The - - PDF document

mol2net 2017 3 doi 10 3390 mol2net 03 xxxx 2 introduction
SMART_READER_LITE
LIVE PREVIEW

MOL2NET, 2017 , 3, doi:10.3390/mol2net-03-xxxx 2 Introduction The - - PDF document

MOL2NET, 2017 , 3, doi:10.3390/mol2net-03-xxxx 1 MOL2NET, International Conference Series on Multidisciplinary Sciences MDPI http://sciforum.net/conference/mol2net-03 Prediction of pH-dependent aqueous solubility of druglike molecules of


slide-1
SLIDE 1

MOL2NET, 2017, 3, doi:10.3390/mol2net-03-xxxx 1

MDPI

MOL2NET, International Conference Series on Multidisciplinary Sciences http://sciforum.net/conference/mol2net-03

Prediction of pH-dependent aqueous solubility of druglike molecules of different chemical behavior

<Laura Machín Galarza> (laura@ifal.uh.cu) a, <Luis Alberto Torres Gómez> (luistg@ifal.uh.cu)a

a <Department of Pharmacy. Institute of Pharmacy and Foods. University of the Havana>

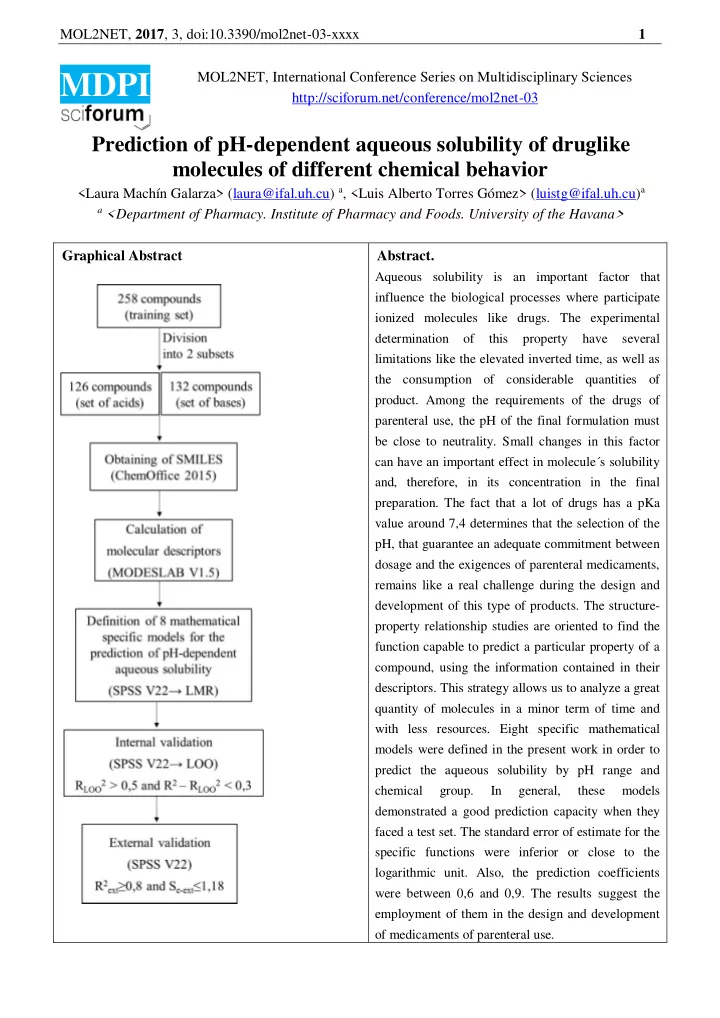
Graphical Abstract Abstract.

Aqueous solubility is an important factor that influence the biological processes where participate ionized molecules like drugs. The experimental determination

  • f

this property have several limitations like the elevated inverted time, as well as the consumption of considerable quantities of

  • product. Among the requirements of the drugs of

parenteral use, the pH of the final formulation must be close to neutrality. Small changes in this factor can have an important effect in molecule´s solubility and, therefore, in its concentration in the final

  • preparation. The fact that a lot of drugs has a pKa

value around 7,4 determines that the selection of the pH, that guarantee an adequate commitment between dosage and the exigences of parenteral medicaments, remains like a real challenge during the design and development of this type of products. The structure- property relationship studies are oriented to find the function capable to predict a particular property of a compound, using the information contained in their

  • descriptors. This strategy allows us to analyze a great

quantity of molecules in a minor term of time and with less resources. Eight specific mathematical models were defined in the present work in order to predict the aqueous solubility by pH range and chemical group. In general, these models demonstrated a good prediction capacity when they faced a test set. The standard error of estimate for the specific functions were inferior or close to the logarithmic unit. Also, the prediction coefficients were between 0,6 and 0,9. The results suggest the employment of them in the design and development

  • f medicaments of parenteral use.
slide-2
SLIDE 2

MOL2NET, 2017, 3, doi:10.3390/mol2net-03-xxxx 2 Introduction The facility/difficulty of ionization of a particular drug have to be consider during the experimental determination of its solubility, due to in the majority of the cases the drugs behave as acids or bases weekly ionizable. In this sense, the pKa of the molecule and the pH of the solution are factors of major interest1; whose dependence with solubility is shown in the pH-solubility profile of each compound. However, the experimental determination of aqueous solubility of ionizable molecules accompanies several limitations, like the high time invested, as well as the elevated consumption of product2. In the

  • ther hand, the parenteral preparations have to satisfy some requirements in order to reach an adequate

adaptation to physiological conditions of blood and tissues. Among these requirements, the pH of the final formulation have to be close to neutrality3. But, small changes in this factor can have an important effect in molecule´s solubility, as well as in its concentration in the final preparation.4 To choose the pH, that accomplish an adequate commitment between the drug dose and the exigences of this type of preparations, is one of the main challenges to face in the design and development of parenteral products; taking into account that a lot of drugs have a pKa value close to 7,4. An interesting alternative is the combined employment of experimental and computational methods. Specifically, the Quantitative structure-property relationship (QSPR) studies are oriented to find the best function that predict a determined quality of a compound, using the information that contain its molecular descriptors. In this sense, the MODESLAB approach is used in order to calculated the spectral moments of the adjacency matrix between edges of the molecular graph with suppressed hydrogens.5 The main objective of the present work was to predict the aqueous solubility of druglike molecules considering four ranges of pH close to neutrality and two different chemical behaviors. Materials and Methods A training set and a prediction one of 258 and 46 compounds were designed respectively. Both sets were divided into two subgroups attending to their chemical behavior: (i) the acid one and (ii) the basic

  • ne. The spectral moments of each compound were calculated with the MODESLAB software by

weighting the following molecular graphs: bond distance (Std), dipole moment (Dip), hydrophobicity (Hyd), polarization (Pol), atomic radius of van der Waals (Van) and atomic weight (Ato). As a result, a matrix containing the spectral moments from μ0 to μ15 was obtained for each molecule. The logS values were obtained from the ACD/Labs program. The statistical software IBM SPSS version 22 for Windows was used for the definition of mathematical predictive models, using multiple linear regression. Results and Discussion After the processing of the training set eight mathematical predictive models (M1-8) were obtained, four for each chemical group. Each function predicts the logS of compounds in a specific range: (i) 6,5-6,7; (ii) 6,8-7; (iii) 7,1-7,3 and (iv) 7,4-7,5. The functions that correspond to the acid group included five descriptors, whereas those that describe the basic one included seven descriptors.

𝑚𝑝𝑕𝑇𝑞𝐼:6,5−6,7 = ,048 (μ4

𝑒𝑗𝑞) − ,157 (μ3 𝑒𝑗𝑞) − ,167 (μ2 𝑞𝑝𝑚) + ,043 (μ1 𝑏𝑢𝑝) − ,005 (μ5 ℎ𝑧𝑒) + 1,149

(M1, acid group)

𝑚𝑝𝑕𝑇𝑞𝐼:6,8−7 = ,048 (μ4

𝑒𝑗𝑞) − ,153 (μ3 𝑒𝑗𝑞) − ,169 (μ2 𝑞𝑝𝑚) + ,044 (μ1 𝑏𝑢𝑝) − ,006 (μ5 ℎ𝑧𝑒) + 1,237

(M2, acid group)

𝑚𝑝𝑕𝑇𝑞𝐼:7,1−7,3 = ,047 (μ4

𝑒𝑗𝑞) − ,150 (μ3 𝑒𝑗𝑞) − ,169 (μ2 𝑞𝑝𝑚) + ,044 (μ1 𝑏𝑢𝑝) − ,006 (μ5 ℎ𝑧𝑒) + 1,313

(M3, acid group)

𝑚𝑝𝑕𝑇𝑞𝐼:7,4−7,5 = ,046 (μ4

𝑒𝑗𝑞) − ,144 (μ3 𝑒𝑗𝑞) − ,166 (μ2 𝑞𝑝𝑚) + ,044 (μ1 𝑏𝑢𝑝) − ,006 (μ5 ℎ𝑧𝑒) + 1,337

(M4, acid group)

slide-3
SLIDE 3

MOL2NET, 2017, 3, doi:10.3390/mol2net-03-xxxx 3

𝑚𝑝𝑕𝑇𝑞𝐼:6,5−6,7 = −2,221 (μ0 ) − ,113 (μ3

𝑞𝑝𝑚) + 1,44 (μ1 𝑞𝑝𝑚) + 1,107 (μ1 𝑡𝑢𝑒) + ,177 (μ3 ℎ𝑧𝑒)

+ 5,664𝐹 − 10 (𝜈5

𝑏𝑢𝑝) − 1,361 (μ1 ℎ𝑧𝑒) + ,751

(M5, basic group)

𝑚𝑝𝑕𝑇𝑞𝐼:6,8−7 = −2,177 (μ0 ) − ,111 (μ3

𝑞𝑝𝑚) + 1,411 (μ1 𝑞𝑝𝑚) + 1,082 (μ1 𝑡𝑢𝑒) + ,173 (μ3 ℎ𝑧𝑒)

+ 5,571𝐹 − 10 (𝜈5

𝑏𝑢𝑝) − 1,374 (μ1 ℎ𝑧𝑒) + ,778

(M6, basic group)

𝑚𝑝𝑕𝑇𝑞𝐼:7,1−7,3 = −2,128 (μ0 ) − ,109 (μ3

𝑞𝑝𝑚) + 1,38 (μ1 𝑞𝑝𝑚) + 1,054 (μ1 𝑡𝑢𝑒) + ,169 (μ3 ℎ𝑧𝑒)

+ 5,469𝐹 − 10 (𝜈5

𝑏𝑢𝑝) − 1,361 (μ1 ℎ𝑧𝑒) + ,809

(M7, basic group)

𝑚𝑝𝑕𝑇𝑞𝐼:7,4−7,5 = −2,081 (μ0 ) − ,107 (μ3

𝑞𝑝𝑚) + 1,35 (μ1 𝑞𝑝𝑚) + 1,026 (μ1 𝑡𝑢𝑒) + ,165 (μ3 ℎ𝑧𝑒)

+ 5,355𝐹 − 10 (𝜈5

𝑏𝑢𝑝) − 1,351 (μ1 ℎ𝑧𝑒) + ,835

(M8, basic group)

The statistical parameters obtained for the eight QSPR models after internal validation, using leave-

  • ne-out (LOO) procedure, as well as external validation are shown in table 1.

Table 1. Statistical performance of the QSPR models. Group Model pH range R R2 Se R2LOO Se-LOO R2ext Se-ext acid 1 6,5 – 6,7 ,899 ,807 ,951 ,768 1,03 ,804 ,927 2 6,8 – 7 ,906 ,821 ,939 ,782 1,02 ,809 ,972 3 7,1 – 7,3 ,911 ,829 ,928 ,790 1,01 ,827 ,889 4 7,4 – 7,5 ,913 ,834 ,912 ,794 1,00 ,804 1,18 basic 5 6,5 – 6,7 ,852 ,725 1,00 ,672 1,06 ,845 ,51 6 6,8 – 7 ,859 ,738 ,991 ,687 1,04 ,831 ,529 7 7,1 – 7,3 ,866 ,750 ,973 ,701 1,02 ,813 ,572 8 7,4 – 7,5 ,872 ,761 ,956 ,713 1,01 ,799 ,625

R: correlation coefficient, R2: determination coefficient, Se: standard error of estimate, R2LOO: cross correlation coefficient, Se-LOO: standard cross correlation coefficient, Rext2: prediction coefficient for external test, Se, pred: standard error for external test.

The contribution of descriptors to solubility in the mathematical models that correspond to the same group is different for each pH range, which demonstrates the importance of considering this factor in the prediction of the solubility of ionized drug compounds. For the functions that described the solubility behavior of the acid and basic groups, the R and R2 values were superior to 0,85 and to 0,72, respectively; which suggest that the molecular descriptors involved are capable to explain more than the 85% and 72% of pH-dependent solubility´s variability, as well as a good adjustment of the predicted values to the experimental ones. Also, the eight models accomplished the cross validation criteria, due to RLOO2 > 0,5 and R2 – RLOO2 < 0,3. In the other hand, according to the R2ext obtained, we can consider that the models obtained are capable to explain around the 80% of the variability of the aqueous solubility of drug compounds that were not considered for the construction of the models. Also, the Se-ext inferior to or close to the logarithmic unit indicates an adequate prediction capacity of them.

slide-4
SLIDE 4

MOL2NET, 2017, 3, doi:10.3390/mol2net-03-xxxx 4 Conclusions The eight mathematical predictive models presented in this study showed R2ext values superior to and close to 0,8; as well as Se-ext values inferior to or close to the logarithmic unit. The results presented suggest the employment of these models in the prediction of aqueous solubility of druglike molecules, as a part of the design and development of parenteral preparations. References

  • 1. Li, P. et al. (1999). Solubilization of ionized and un-ionized flavopiridol by ethanol and polysorbate 20. J.
  • Pharm. Sci., 88: 507–509.
  • 2. Duchowicz, P. & Castro, E. A. (2009). QSPR Studies on Aqueous Solubilities of Drug-Like Compounds,
  • Int. J. Mol. Sci., 10: 2558-2577.
  • 3. The Department of Health. General monographs. Parenteral preparations. British Pharmacopeia (BP)

Volume III. (2009).

  • 4. Vila, J. L. (2005). Formas farmacéuticas Vol. II. 157-249.
  • 5. Estrada, E. & Gutiérrez, Y. (2002). MODESLAB for Windows User’s Manual, University of Santiago de

Compostela, Santiago de Compostela.