
SLIDE 1
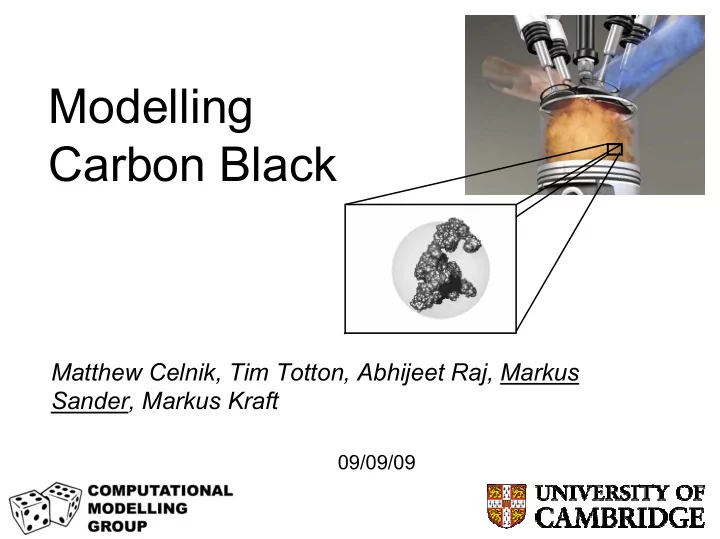
Modelling Carbon Black
Matthew Celnik, Tim Totton, Abhijeet Raj, Markus Sander, Markus Kraft
09/09/09
Modelling Carbon Black Matthew Celnik, Tim Totton, Abhijeet Raj, - - PowerPoint PPT Presentation
Modelling Carbon Black Matthew Celnik, Tim Totton, Abhijeet Raj, Markus Sander, Markus Kraft 09/09/09 Soot Formation Temperature Reaction Zone Burner Flame Carbon Addition Reactions Condensation of PAHs Particle Inception by PAHs
09/09/09
Markus Sander ms785@cam.ac.uk
Burner
Temperature
Flame Condensation of PAHs Coalescense Particle Inception by PAHs Aggregation Carbon Addition Reactions Oxidation by O2 and OH,
Markus Sander ms785@cam.ac.uk
Markus Sander ms785@cam.ac.uk
Quantum Chemistry (DFT) Full representation of molecules
Determine kinetic parameters
PAH Aromatic Site Model (ARS) Functional site description
PAH reactions as jump processes
Kinetic Monte-Carlo (PAH KMC) Single planar PAH simulations
Used to generate internal particle structure
Population Balance (PAH-PP) Particle ensemble modelling
Particles described by PAH-PP Model Inception, growth and coagulation
Markus Sander ms785@cam.ac.uk
PAH: Polyaromatic hydrocarbons
Oxidation process: Decomposition process:
Markus Sander ms785@cam.ac.uk
Markus Sander ms785@cam.ac.uk
Units: k in cm3/(mole*s), T in K Zigzag next to zigzag (zz)
Eact=156 kJ/mole
Zigzag next to free edge (zf)
Eact=161 kJ/mole
Armchair next to free edge (af)
Eact=173 kJ/mole
Markus Sander ms785@cam.ac.uk
S1 S2 S3 S4 S5 S6 Free-edge growth Free-edge desorption 5-member ring addition 5-member ring desorption Armchair growth 5- to 6-member ring Frenklach, Wang, Violi
Markus Sander ms785@cam.ac.uk
Seed molecule: Seed molecule: Pyrene Pyrene Growth of a PAH molecule – kinetic Monte Carlo (KMC) simulation
Markus Sander ms785@cam.ac.uk
Markus Sander ms785@cam.ac.uk
Markus Sander ms785@cam.ac.uk
n: number of primary particles p of particle P C: Matrix containing the sphericity of the neighbouring primaries Cij=0 if pi and pj are not touching
Each primary particle pi is composed of m PAHs:
1
n
1 m i i
Markus Sander ms785@cam.ac.uk
Contains: [C]2,5 Contains: [C]5,6
Markus Sander ms785@cam.ac.uk
Monomers Dimers Monomers Dimers C2H4 - O2 flame, Pressure = 120 mbar, C/O = 1, Cold gas velocity = 54 cm/sec
Markus Sander ms785@cam.ac.uk
⎟ ⎟ ⎠ ⎞ ⎜ ⎜ ⎝ ⎛ ⎟ ⎟ ⎠ ⎞ ⎜ ⎜ ⎝ ⎛ − ⎟ ⎠ ⎞ ⎜ ⎝ ⎛ + − + = 5 1100 2 exp 1 1
6 min min 3 min
M M D CE
PAH smaller
Mass PAH smaller
Diameter efficiency n Coagulatio
min min
= = = M D CE
Markus Sander ms785@cam.ac.uk
Markus Sander ms785@cam.ac.uk
Alston Misquitta, Aron Cohen, Dwaipayan Chakrabarti, Mark Miller, David Wales
Markus Sander ms785@cam.ac.uk
Energy
Markus Sander ms785@cam.ac.uk
Alston Misquitta, Aron Cohen, Dwaipayan Chakrabarti, Mark Miller, David Wales
Markus Sander ms785@cam.ac.uk
A TEM-style projection
a computed cluster of 50 coronene molecules Experimental HR-TEM images of an aggregate sampled from a diesel engine. Indicated are length scales of structures within a primary particle (from Mosbach et al., 2009, Combustion and Flame).
Markus Sander ms785@cam.ac.uk
Markus Sander ms785@cam.ac.uk
Image from www.engineforall.com
Markus Sander ms785@cam.ac.uk
λ = 1.0 EOI = -50 CAD ATDC Spark = -30 CAD ATDC
Markus Sander ms785@cam.ac.uk
32.6 CAD ATDC 12.6 CAD ATDC 2.6 CAD ATDC
Markus Sander ms785@cam.ac.uk
Markus Sander ms785@cam.ac.uk
10 Coronene molecules 2 Coronene molecules 5 Coronenes molecules E = -94.90 kJ/mol E = -394.35 kJ/mol E = -926.42 kJ/mol
Markus Sander ms785@cam.ac.uk
2.5 3 3.5 4 4.5 5 5.5 6
10 20 Dimer Separation (Å) Potential (kJ/mol) LJ Gr LJ SP LJ X W99 Gr W99 SP W99 X SAPT Gr SAPT SP SAPT X
Graphite (Gr) Slipped Parellel (SP) Crossed (X)
Markus Sander ms785@cam.ac.uk
Markus Sander ms785@cam.ac.uk
Markus Sander ms785@cam.ac.uk
– coronene ρ = 1.1 g/cm3, pyrene ρ = 1.0 g/cm3
Markus Sander ms785@cam.ac.uk
Pictures from: Uitz, Cracknell, Jansma and Makkee, “Impact of diesel fuel composition on soot oxidation Characteristics”, SAE 2009-01-0286