
SLIDE 1
Modeling And Visualizing Fire Without Getting Burned MCSD Seminar - - PowerPoint PPT Presentation
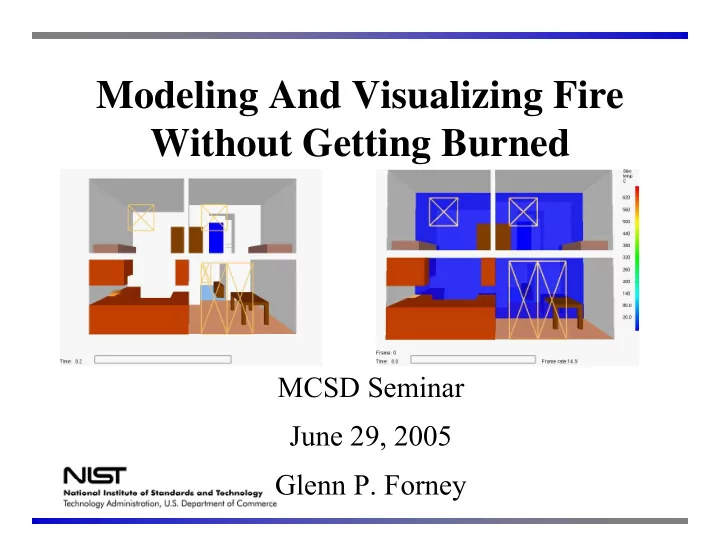
Modeling And Visualizing Fire Without Getting Burned MCSD Seminar June 29, 2005 Glenn P. Forney Overview Fire Models Fire modeling applications Gaining insight through visualization Smokeview Visualization Team FDS
Glenn Forney Kevin McGrattan Howard Baum Ron Rehm Anthony Hamins – experimental validation Steve Kerber – forced ventilation Greg Linteris – fundamental fire Physics Ruddy Mell Ron Rehm Urban-wildland interface problem Dan Madrzykowski Bob Vettori Doug Walton Fire reconstructions
and others… FDS computational model
Kuldeep Prasad – multi-mesh Chuck Bouldin - parallelization
Smokeview visualization
Influence on visualization and Smokeview
within a fire scenario including Flame spread Gas Conc. Fuel package Smoke HRR Ventilation Suppression Radiation
Fire behavior under various ventilation conditions
Trash can HRR = 50 kW Trash can diameter = 0.3 m (1 ft) Estimated Trash Can Flame Height = 0.8 m (2.5 ft) P 138 JQ
(ODE models)
Hot Upper Zone Cool Lower Zone
– Upper / lower layers
– Combustion – Plume flow – Vent flow (entrainment)
Hot Upper Zone Cool Lower Zone
radiation entrainment
f
f
v
v
convection c
r
v
v
U U L L
T T R P ρ ρ = =
U U V U
T m c E =
L L
L L L
U U
U U U
Internal energy work enthalpy
State Equations
Ideal Gas Law Internal Energy
L L V L
T m c E = Conservation of mass and energy
Governing Equations:
U L q
Pressure:
room
U U abs lay
Layer interface:
X X X p
X X p X
Upper/Lower Layer Temperature:
U L U
“Small” changes in P, VU, TL, TU Large changes in dP/dt Stiff ODE solvers required for solution (use DASSL)
Version 1 release, February 2000 Version 4 release, November 2004 http://fire.nist.gov/fds
WTC Phase 1, Test 5, West Aspirated TCs Time (s)
1000 2000 3000
Temperature (C)
200 400 600 800 1000
365 cm (Exp) 215 cm (Exp) 34 cm (Exp) 365 cm (FDS) 215 cm (FDS) 34 cm (FDS)
FDS Validation Experiment 3 MW Fire, 23’x12’x12’ Compartment, 1 hour burn
Fire Dynammics Simulator (FDS) - Modeling Fire Data
Diagnose problems with Physics and Numerics of FDS
Study effects of fire dynamics Cherry Road LODD Incident December 1999 Litigation, Forensic studies, Fire Protection Engineers, Architects, Regulatory agencies NRC, DOE, …
Fight fire “on the computer”
and scale geometry
n 1L
Mi – rotation, translation or scaling matrix transformations x – position vector Motion Color Structure
Shaded Unshaded
Light source normals
light source direction vectors Observer
One normal per triangle glNormal3f(nx,ny,nz); glVertex3f(ux,uy,uz); glVertex3f(vx,vy,vz); glVertex3f(wx,wy,wz); (facet shape) n = (u-v) x (w-v) u v w n
One normal per vertex glNormal3f(nx1,ny1,nz1); glVertex3f(x1,y1,z1); glNormal3f(nx2,ny2,nz2); glVertex3f(x2,y2,z2); glNormal3f(nx3,ny3,nz3); glVertex3f(x3,y3,z3); (smooth shape) u v w
glPointSize(partpointsize); glBegin(GL_POINTS); for (n = 0; n < nsmokepoints; n++) { glColor4fv(rgb[itpoint[n]]); glVertex3f(xplts[xpoints[n]], yplts[ypoints[n]],zplts[zpoints[n]]); } glEnd();
10 5 5 5 5 10
10 5 5 5 5 10
Triangulate so that all hypotenuses follow level curves
Marching Cube Algorithm
isosurface level – 256 cases
3 of 15 cases
Outline Solid
Multiple normals for each vertex Single normal for each vertex
Transparent Solid
tracer particles 3d contours realistic/3D smoke
Observer
Assume “ambient” light source behind smoke
Mix smoke color with background scene color Background scene
Observer
“Ambient” light source behind smoke
Mix smoke color with background scene color Background scene Directional light source
Sun behind clouds Sun above clouds Diffuse/Ambient Light
Using Transparency to Visualize Smoke Physics-based computation of smoke transparency Front View Side View
Using Transparency to Visualize Smoke Physics-based computation of smoke transparency α − οbscuration Δx - distance between adjacent grid planes si- soot density αi = 1 - exp(-ksiΔx) - Beer’s law
in real time for non-axis aligned view distances using: x x Δ Δ
/ ˆ
(need to adjust α’s for planes that remain)
2 / ˆ = Δ Δ X X
2 2
Reality Check
Possible future directions for Smokeview
3D color “space”
“rainbow colorbar” 3D color “space”
Determine colorbar appropriate for use with a thermal imager How does a thermal imager respond to
Use the video card (GPU) to perform scientific computations Why? Pseudo code for 3D smoke visualization
for(i=0;i<ni;i++){ for(j=0;j<nj;j++){ correct α at each grid node { }
CPU - serial GPU - parallel
and gaining insight into the phenomena being studid glenn.forney@nist.gov