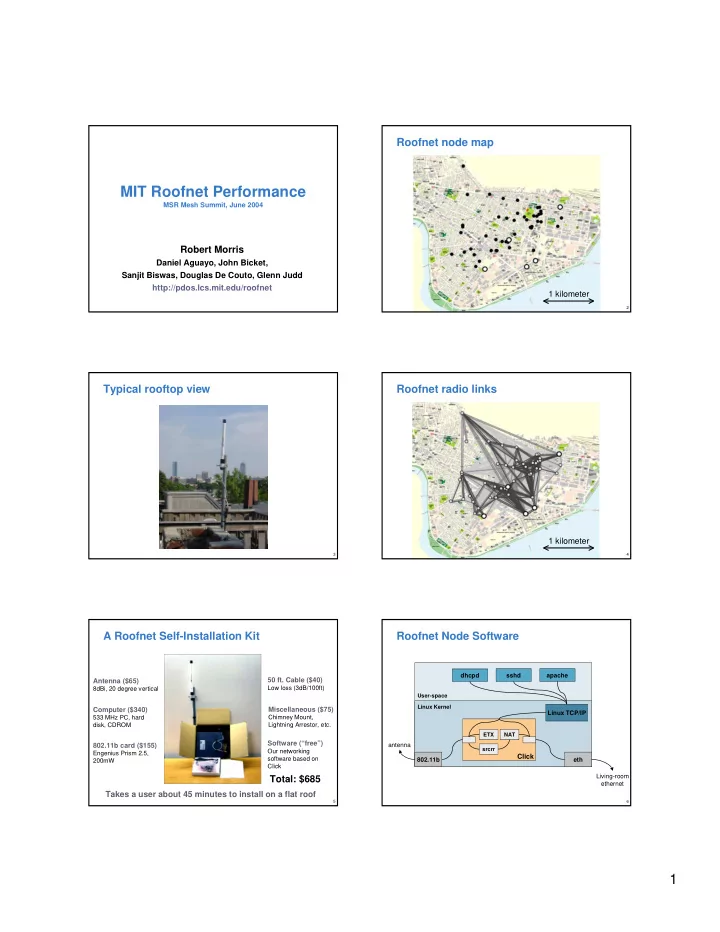
Roofnet node map MIT Roofnet Performance MSR Mesh Summit, June 2004 Robert Morris Daniel Aguayo, John Bicket, Sanjit Biswas, Douglas De Couto, Glenn Judd http://pdos.lcs.mit.edu/roofnet 1 kilometer 2 Typical rooftop view Roofnet radio links 1 kilometer 3 4 A Roofnet Self-Installation Kit Roofnet Node Software dhcpd sshd apache 50 ft. Cable ($40) Antenna ($65) Low loss (3dB/100ft) 8dBi, 20 degree vertical User-space Linux Kernel Computer ($340) Miscellaneous ($75) Linux TCP/IP 533 MHz PC, hard Chimney Mount, Lightning Arrestor, etc. disk, CDROM ETX NAT Software (“free”) 802.11b card ($155) antenna srcrr Our networking Engenius Prism 2.5, Click software based on 802.11b eth 200mW Click Living-room Total: $685 ethernet Takes a user about 45 minutes to install on a flat roof 5 6 1
Basic Roofnet performance Multi-hop collisions cut b/w by about 2x Hops # of Avg TCP Latency Pairs Kilobits/sec ms 1 179 2528 12 2 354 784 22 3 354 368 39 4 256 272 44 5 127 216 61 6 43 248 81 7 38 184 72 8 17 168 98 9 6 152 121 • High TCP throughput even w/ many hops • x-axis: expected multi-hop b/w based on single-hop b/w • y-axis: actual Roofnet b/w is often much lower • Why is 2-hop b/w less than half 1-hop b/w? 7 8 Roofnet link quality distribution S/N vs loss w/ cable + attenuator Packet Delivery Probability 1 megabit/second 11 mbits/sec Node Pair • In principle, the intermediate-loss S/N region is narrow • Why do most links have intermediate loss rates? 9 10 S/N vs loss for Roofnet links Effect of transmit power level on Roofnet • Higher tx power increases radio “range” • Roofnet loss rates cannot be explained by S/N • Increase in # of links between 1/r 2 and 1/r 3 11 12 2
What is a typical radio range? Would a less-dense mesh work? Nodes Connectivity Avg TCP Hop Count Kilobits/sec Delivery probability 4 17% 16 1.3 9 50% 80 2.2 14 95% 144 3.0 19 100% 224 3.5 24 100% 256 3.5 29 100% 256 3.2 34 100% 320 3.3 • Roofnet is about twice as dense as it needs to be Distance (Meters) • Higher densities provide higher throughput 13 14 Mesh versus access points Conclusions APs or AP AP Mesh • Roofnet provides Internet access to 40+ users gateways throughput connections throughput • Even 9-hop routes average 150 kilobits/second 1 160 25 952 • Radio range up to 2km 2 688 34 1616 • Hard to beat mesh performance w/ access points 3 864 38 1880 • Multi-hop packet loss costs about a factor of two 4 1144 40 2096 5 1152 41 2040 6 1608 41 2184 7 1856 41 2296 • 5 APs are required for full connectivity • N mesh gateways give higher throughput than N APs 15 16 Transmit bit-rate choice How reliant on the “best” nodes? 11 megabits/second Average Throughput (KB/s) Packets/second received 5.5 2 1 Node Pair Number of Best Nodes Eliminated 17 18 3
Recommend
More recommend