
SLIDE 1
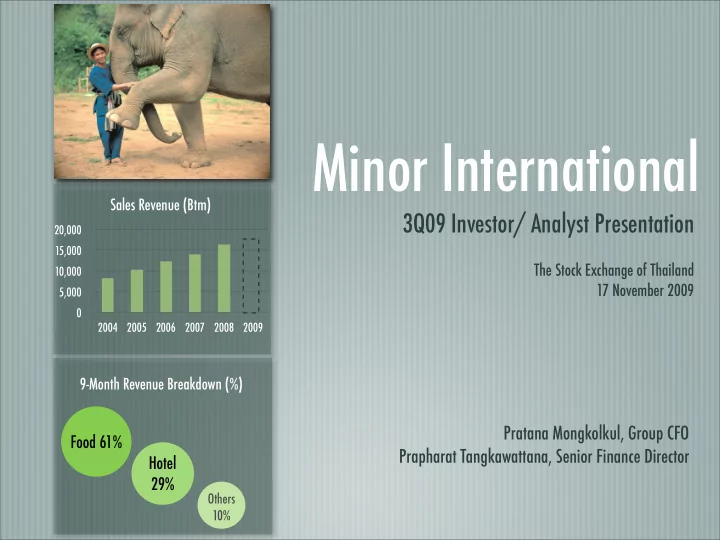
9-Month Revenue Breakdown (%)
3Q09 Investor/ Analyst Presentation
The Stock Exchange of Thailand 17 November 2009
Pratana Mongkolkul, Group CFO Prapharat Tangkawattana, Senior Finance Director
Minor International
Food 61% Hotel 29%
Others 10%
5,000 10,000 15,000 20,000 2004 2005 2006 2007 2008 2009
Sales Revenue (Btm)