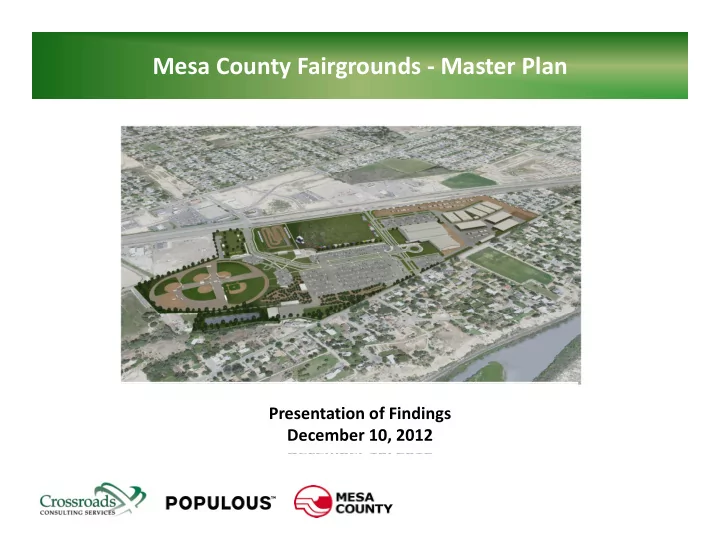
SLIDE 1
Mesa County Fairgrounds ‐ Master Plan
December 10, 2012 Presentation of Findings December 10, 2012 December 10, 2012
SLIDE 2
Master Plan Evolved from Several Research Initiatives Over the Last Five Years
2010 2007 Markin Study: 2009 Internal Study: 2010 Steering Committee Formed and 2012 Crossroads/ Populous Business Plan Study: The Big Ideas Formed and Focus Group Meetings Held Populous Master Plan
1
SLIDE 3
Potential Development Concepts
Regional Equestrian & Livestock Livestock Facility Mesa County Fairgrounds Themes/ C f Expo/ Event Facility BMX/ Extreme Sports Center Courses of Action y p Recreational Facility
2
SLIDE 4
Project Team
Crossroads Consulting Services g
Crossroads is a market leader in providing advisory and development planning services to public assembly facilities development planning services to public assembly facilities
P l Populous
Populous is the world’s leading design firm dedicated exclusively to creating environments that draw people and communities together for unforgettable experiences
3
SLIDE 5
Work Plan Served as the Basis of the Master Plan
l i l Multiple Work Sessions with Diverse Existing Facilities Assessment Market Analysis Business Plan with Diverse Stakeholders Assessment y
4
SLIDE 6
Several Factors Influence the Recommended Program and Prioritization of Master Plan Elements
Operating Objectives/ Marketability/ Marketability/ Functionality Physical Program/ Design/Cost Business Model/ Return on Investment
5
SLIDE 7
Market Analysis Assesses Potential Demand, Defines Program, and Drives the Economic Analysis and Business Plan
Market Attributes Input from Historical Operations Input from Demand Generators Industry Trends Competitive/ Comparable Facilities
6
SLIDE 8
Master Plan is Segregated by Geographic Area and Major Activity
7
SLIDE 9
P j t C t E ti t $6 8 M
8
Project Cost Estimate: $6.8 M
SLIDE 10
9
SLIDE 11
P j t C t E ti t $6 8 M
10
Project Cost Estimate: $6.8 M
SLIDE 12
P j C E i $7 1 M
11
Project Cost Estimate: $7.1 M
SLIDE 13
P j C E i $39 7 M
12
Project Cost Estimate: $39.7 M
SLIDE 14
Business Plan Provides a Guideline for Future Operations
Impact to Economic Impacts Potential Usage/ Event Activity Impact to Financial Operations ‐ Spending ‐ Jobs ‐ Earnings Tax Revenues ‐ Sales and Use Tax Recommended Changes to O i Opportunities to Positively Impact Construction and ‐ Lodging Tax ‐ Income Tax Operating Strategies Construction and Ongoing Operating Costs
13
SLIDE 15 Estimated Range of Incremental Usage/Event Activity at the Fairgrounds in a Stabilized Year
Option Events Usage Days Attendee Days Master Plan West 7 ‐ 11 10 ‐ 16 15,000 – 25,500 Master Plan East 17 ‐ 20 45 ‐ 51 24 000 – 26 600 Master Plan East 17 20 45 51 24,000 26,600 Master Plan Complete 77 ‐ 93 171 ‐ 205 153,400 – 189,800 Complete
- The Fairgrounds is typically used more than 295 days per year to
host nearly 500 activities that attract 100 000 attendees including host nearly 500 activities that attract 100,000 attendees including the Fair.
14
SLIDE 16
Estimated Impact to Fairgrounds Financial Operations in a Stabilized Year
Category Three‐ Year Avg Master Plan West Only Master Plan East Only Master Plan Complete Operating Revenues $125,000 $164,500 $433,000 $1,191,000 Operating Expenses $375,000 $396,500 $535,500 $1,422,500 O i S b id $ $ $ $ Operating Subsidy ($250,000) ($232,000) ($102,500) ($231,500) Change in $ $18,000 $147,500 $18,500 g $ 8,000 $ ,500 $ 8,500 Change in % ‐7% ‐59% ‐7%
15
Note: Master Plan amounts represent midpoint of the range.
SLIDE 17
Estimated Economic Impacts Generated From Ongoing Fairgrounds Operations in a Stabilized Year
215 250 $10 0 $12.0 ns) Direct Spending Total Jobs 150 200 $8.0 $10.0 Tot $ in million $10.1 50 60 90 100 $4.0 $6.0 al Jobs Spending ( $2.4 $2.9 $4.4 50 50 $0.0 $2.0 Direct S
Note: Master Plan amounts represent midpoint of the range
Historical Avg MP West MP East MP Complete 16
Note: Master Plan amounts represent midpoint of the range.
SLIDE 18 Estimated Tax Revenues Generated From Ongoing Fairgrounds Operations in a Stabilized Year
Jurisdiction Three‐Year Average Master Plan West Master Plan East Master Plan Complete Mesa County $47,000 $55,000 $84,000 $182,000 City of Grand Junction $94,000 $105,500 $164,500 $334,000 State of Colorado $94 000 $111 000 $168 500 $374 500 State of Colorado $94,000 $111,000 $168,500 $374,500 Grand Total $235,000 $271,500 $417,000 $890,500
Note: Master Plan amounts represent midpoint of the range.
- Tax revenues include sales and use tax, lodging tax, and income tax.
17
SLIDE 19 Business Plan Provides a Guideline for Various Policy‐Related Issues and Operating Strategies
Recommended Changes to Operating Strategies Management Alternatives Potential Revenue Sources That Could Impact Cost Operating Strategies
- Mission Statement
- Booking Policy/
- Governmental
Management Impact Cost
- Naming Rights
- Concessionaire Rights
P i Ri ht Prioritization
- Marketing Efforts
- Rate Structure
- Independent
Authority
- Not‐for‐Profit
- Pouring Rights
- Long‐Term Advertising/
Sponsorship Sales
Rate Structure
- Staffing Levels
- Performance
Measures
Management
Parcels
Investment Measures Investment
18
SLIDE 20 Mesa County Fairgrounds Master Plan Summary
- Driving forces of the master plan
Accommodate di erse comm nit sage – Accommodate diverse community usage – Minimize the financial operating subsidy – Maximize economic/fiscal impacts to the community
- Market demand exists for improvements/enhancements to the
- Market demand exists for improvements/enhancements to the
Fairgrounds that can accomplish the above objectives
- This project allows local government to positively impact the economy
- This project allows local government to positively impact the economy
through its financial investment
19
SLIDE 21 Why Now?
– Community Feedback and User Consensus – Market Demand – Business Plan
- Committed CIP Funds
- Low Construction Costs
- Low Construction Costs
- Economic Impact and Jobs
- Potential Funding Partners
- Grants Opportunities to Leverage County Dollars
20
SLIDE 22
Questions and Discussion
21