
SLIDE 1
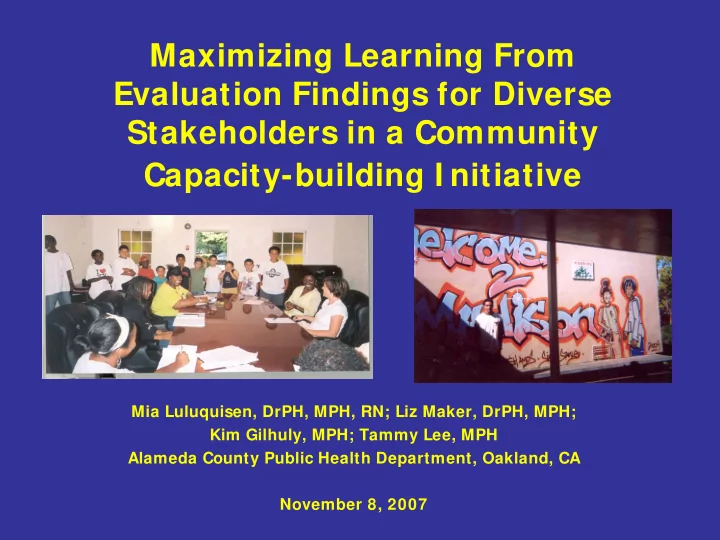
Maximizing Learning From Evaluation Findings for Diverse Stakeholders in a Community Capacity-building I nitiative
Mia Luluquisen, DrPH, MPH, RN; Liz Maker, DrPH, MPH; Kim Gilhuly, MPH; Tammy Lee, MPH Alameda County Public Health Department, Oakland, CA November 8, 2007