
SLIDE 1
1
Market demand first half, 2000 North America Europe White White - - PowerPoint PPT Presentation
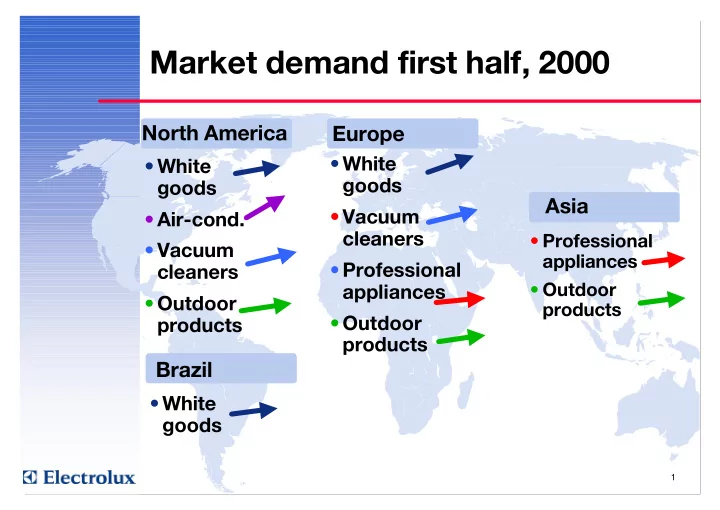
Market demand first half, 2000 North America Europe White White goods goods Asia Vacuum Air-cond. cleaners Professional Vacuum appliances Professional cleaners Outdoor appliances Outdoor products
1
2 4 6 8 10 12
1/95 2/95 3/95 4/95 1995 1/96 2/96 3/96 4/96 1996 1/97 2/97 3/97 4/97 1997 1/98 2/98 3/98 4/98 1998 1/99 2/99 3/99 4/99 1999 1/00 2/00
Change in % vs same period previous year %
3
5 10 15 20
IT DE FR ES GB LU BE AT CH GR NL PT IE NO DK SF SE
%
Total Europe
First half 2000/First half 1999 Q2 2000/Q2 1999
4
5 10 15
1/95 2/95 3/95 4/95 1995 1/96 2/96 3/96 4/96 1996 1/97 2/97 3/97 4/97 1997 1/98 2/98 3/98 4/98 1998 1/99 2/99 3/99 4/99 1999 1/00 2/00
% Core appliances Major appliances
5
52,780 993 5,497 1,095 4,119 58,420 +17.7%
+6.3%
+4.4%
+3.5%
6
Net sales 65,428 62,074 5% 34,199 33,021 4% Operating income 4,503 3,807 18% 2,453 2,151 14% Margin, % 6.9 6.1 7.2 6.5 Income after financial items 4,071 3,219 26% 2,285 1,835 25% Margin, % 6.2 5.2 6.7 5.6 Net income per share, SEK 7.35 5.75 28% 4.10 3.25 26% Value creation 1,731 840 891 1,040 657 383 Return on equity, % 20.9 17.2
Change Second quarter 2000 1999 First half 2000 1999 Change SEKm
7
First half 2000 1999 Full year 1999
Net income per share, SEK 7.35 5.75 4.10 3.25 11.40 Return on equity, % 20.9 17.2 17.1 Return on net assets, % 23.5 18.3 18.3 Net debt/equity ratio 0.61 0.80 0.50 Capital expenditure, SEKm 1,992 1,984 1,068 1,228 4,439 Average number of employees 88,700 94,800 88,700 95,300 92,916
Second quarter 2000 19999
8
Net sales 65,428 62,074 34,199 33,021 119,550 Cost of goods sold
Selling expense
Administrative expense
Other operating income/expense
Items affecting comparability
Operating income* 4,503 3,807 2,453 2,151 7,204 Margin, % 6.9 6.1 7.2 6.5 6.0 Financial items, net
Income after financial items 4,071 3,219 2,285 1,835 6,142 Margin, % 6.2 5.2 6.7 5.6 5.1 Taxes
Minority interests in net income 15
38 Net income 2,698 2,100 1,510 1,188 4,175 * Including depreciation in the amount of:
First half 2000 1999 Full year, 1999
Second quarter 2000 1999
9
Fixed assets 27,979 26,860 28,051 Inventories, etc. 16,955 17,085 16,171 Accounts receivable 27,081 25,801 21,513 Other receivables 6,007 5,694 5,597 Liquid funds 9,698 8,569 10,312 Total assets 87,720 84,009 81,644 Shareholders’ equity 26,113 24,017 25,781 Minority interests 792 882 825 Interest-bearing liabilities and provisions 26,190 28,454 23,735 Non-interest-bearing liabilities and provisions 34,625 30,656 31,303 Total equity and liabilities 87,720 84,009 81,644
10
SEKm
Net sales, FH/00 FH/99 Consumer Durables Europe 20,434 20,697 984 906 379 274 Margin, % 4.8 4.4 North America 26,991 23,294 2,125 1,708 1,170 711 Margin, % 7.9 7.3 Rest of the world 4,210 3,680
Margin, %
Total Consumer Durables 51,635 47,671 3,027 2,454 950 282 Margin, % 5.9 5.1 Professional Products Indoor 9,288 10,584 1,096 1,014 674 495 Margin, % 11.8 9.6 Outdoor 4,331 3,677 604 505 398 338 Margin, % 13.9 13.7 Total Professional Products 13,619 14,261 1,700 1,519 1,072 833 Margin, % 12.5 10.7 Operating income, FH/00 FH/99 Value creation, FH/00 FH/99
11
SEKm
1000 2000 3000 4000 5000 6000
1997 1998 1999 FH/2000 2001 2002