
SLIDE 1
Sandia National Laboratories is a multi-mission laboratory managed and operated by Sandia Corporation, a wholly owned subsidiary of Lockheed Martin Corporation, for the U.S. Department of Energy’s National Nuclear Security Administration under contract DE-AC04-94AL85000. SAND2016-10739 C.
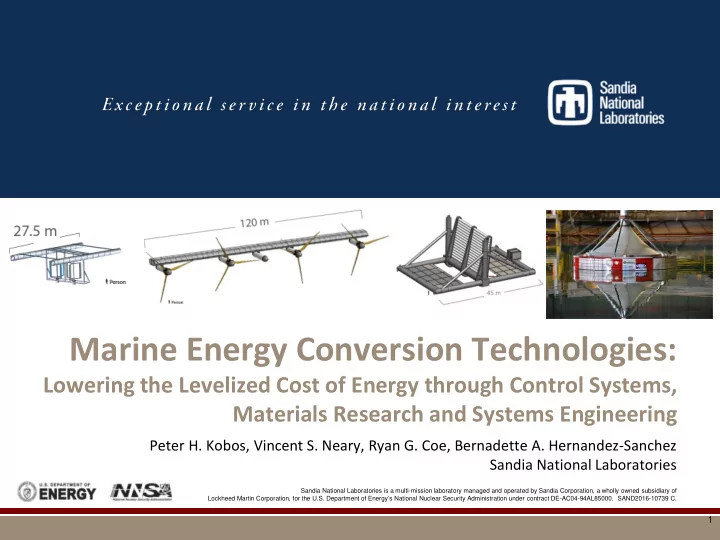
Marine Energy Conversion Technologies:
Lowering the Levelized Cost of Energy through Control Systems, Materials Research and Systems Engineering
Peter H. Kobos, Vincent S. Neary, Ryan G. Coe, Bernadette A. Hernandez-Sanchez Sandia National Laboratories
1