
SLIDE 1
Marina Bay Financial Centre Marina Bay Financial Centre 17 November - - PowerPoint PPT Presentation
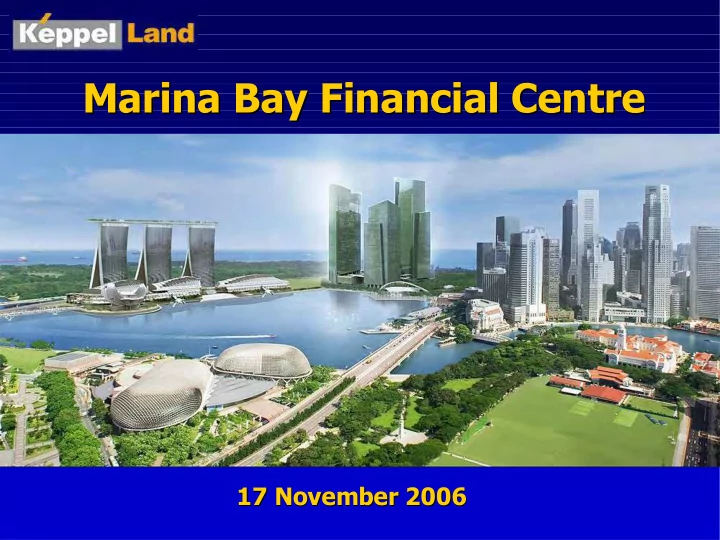
Marina Bay Financial Centre Marina Bay Financial Centre 17 November 2006 17 November 2006 Presentation Outline Introduction Background Strategic Location One Raffles Quay Marina Bay Financial Centre Phase 1 Details
2
4
Downtown at Marina Bay – Singapore’s new CBD area
first development in this area
Centre (MBFC) strengthens KLL’s foothold in the New Downtown
Bayfront MRT Station Landmark MRT Station Integrated Resort & Casino One Marina Boulevard One Raffles Quay The Sail @ Marina Bay MBFC Phase 1 MBFC Phase 2
R A F F L E S A V E N U E M A R I N A B L V D STRAITS BLVD SHENTON WAY
Marina Bay Marina Channel S ore River
BAYFRONT AVE
proposed bridge
C O L L Y E R Q U A Y
Marina Bay MRT Station Raffles Place MRT Interchange
(white site)
New tourism icon [ferris wheel]
MBFC Phase 1
5
One Raffles Quay
Marina Bay Integrated Resort Landmark MRT station
Crown jewel of Marina Bay, linking One Raffles Quay, Esplanade Theatres, Marina Bay Integrated Resort and Landmark MRT station
Esplanade Theatres Existing hotels, convention and retail facilities
6
– Developed with Cheung Kong and Hongkong Land, Asia’s leading property companies – Consortium now embarking on 2nd project Marina Bay Financial Centre
– Site acquired in Mar 01 at $290 psf – Commenced work in Jun 02 – TOP : North Tower Oct 06 South Tower Apr 06
North Tower South Tower
– Deutsche Bank, UBS, ABN Amro, Ernst & Young, Credit Suisse and Barclays
8
– “City in a Garden” integrated workplay environment – Contribute to the fulfilment of vision for Marina Bay – Strengthen Singapore’s position as Asia’s key financial hub
– Site area : 3.55ha – Land price : $381 psf
Marina Bay Financial Centre One Raffles Quay Raffles Place CBD
9
Guidelines : – At least 60% for office space – Remaining 40% for white site use
Remaining (194,000 sm) 8 years option Ph 1 (244,000 sm) : Office : 180,000 sm Resi & retail : 64,000 sm
Total GFA : 438,000 sm
Ph 1 Resi & Retail Ph 1 Office Remaining portion
10
– NLA : 1.65 mil sf
One residential tower (total 428 units)
– NSA : 0.56 mil sf
Bay area and the Straits of Singapore
Pederson Fox Associates
11
– Two office towers (32 and 46storeys) – 1.65 mil sf (NLA) of grade A office space – Large columnfree floor plates of 21,000 sf and 24,000 sf
Marina Bay Residences 46storey Office Tower 32storey Office Tower
12
– Residential component of Marina Bay Financial Centre – Comprises 428 luxury waterfront homes fronting Marina Bay – Features 1, 2, 3, and 4bedroom units as well as penthouses in 55storey tower – Wellpositioned to meet strong international demand – Plan to launch 200 units in 4Q06
Marina Bay Residences
14
companies and expansion of existing ones (URA)
– Grade A office occupancy : 99.3% (CBRE) – Avg Grade A office rentals : $7.60 psf, up 11.8% qoq (CBRE)
– 20072010 : Average new supply of 0.74 mil sf p.a. (CBRE) – Redevelopment to reduce CBD space by 1.5 mil sf (78% of current stock)
– Prime rents up 41% yoy to $6.90 psf/mth, highest since end2001 (URA) – Grade A and prime rentals projected to rise by >9% and >5% respectively by end2006 (CBRE)
15
Source : URA, CBRE and KLL
Expected Completion Proposed Office Projects NFA (sf) 2006 Parakou Building 64,000 One Raffles Quay 1,322,534 55 Market Street addition 78,000 SIF Building Redevelopment 68,000 Sub total 1,532,534 2007 LKN Building Redevelopment 80,800 VisionCrest 139,000 Central (office block only) 179,000 Sub total 398,800 2008 Selegie Road Office/Soho/Retail /Serviced Apt development 82,000 HarbourFront Tower 5 208,000 Sub total 290,000 2009 Overseas Union House Redevelopment 415,000 Crosby House Redevelopment 228,000 Subtotal 643,000 2010 MBFC (Phase 1) 1,646,876 Total (20062010) 4,511,210
16
89.6 89.2 86.4 85.4 84.3 83.7 83.1 82.6 82.1 82.2 82.7 83.5 84.0 85.0 86.6 87.2 88.0 89.5 88.8 89.0 85.2 85.7 87.7
78 80 82 84 86 88 90 92 1Q01 2Q01 3Q01 4Q01 1Q02 2Q02 3Q02 4Q02 1Q03 2Q03 3Q03 4Q03 1Q04 2Q04 3Q04 4Q04 1Q05 2Q05 3Q05 4Q05 1Q06 2Q06 3Q06 % 1 2 3 4 5 6 7 8 S$psf/mth
Islandwide Occupancy Prime Rentals
Islandwide Office Occupancy and Prime Rentals
17
Ranking City US$/sf/annum Ranking City US$/sf/annum 1 London (West End), England 185.60 17 New Delhi, India 63.28 2 Tokyo (Inner Central), Japan 130.05 21 Milan, Italy 60.05 3 London (City), England 127.49 23 New York Midtown Manhattan 55.15 4 Tokyo (Outer Central), Japan 117.90 26 Frankfurt am Main, Germany 54.26 5 Hong Kong 101.67 27 Madrid, Spain 54.13 7 Mumbai (Bombay), India 93.06 37 Shanghai (Pudong), China 44.86 8 Paris, France 92.48 39 Shanghai (Puxi), China 43.30 11 Edinburgh, Scotland 72.85 40 Washington, DC (CBD) 42.74 14 Seoul, South Korea 68.99 43 Singapore 41.53(S$5.45psf/mth)
Global 50 Index (by occupation cost in US$ psf per annum)
Source : CBRE Global Market Rents (May 2006) USD : SGD =1.576
18
takeup of highend homes
– Highend price hit : $3,000 psf for Tomlinson area, $2,300 psf for Ardmore Park area, and $1,800 psf for Sentosa condominiums
more foreign buyers
– 22% or 3,143 of the 14,286 homes sold in JanSep 06 were bought by foreigners (Savills Singapore)
and luxury waterfront homes likely to fuel demand
19
– More than 6,700 new units sold in JanSep 06, up 2.7% yoy (URA) – Prices up 6.1% in first nine months of 2006, with the 2.7% rise in 3Q06 being the highest quarterly increase in 6 years (URA)
5,785 8,955 6,736 5,156 9,485 7,189 5,406 8,171 6,096 5,520 9,565 125.4 118.2 113.8 112.8 115.1 117.2 132.8 134.2 100 151.6 173.1
2,000 4,000 6,000 8,000 10,000 12,000 1996 1997 1998 1999 2000* 2001 2002 2003 2004 2005 13Q2006
80 100 120 140 160 180 Price Index
Total Primary Demand Price Index
URA Private Residential Demand and Price Index
20