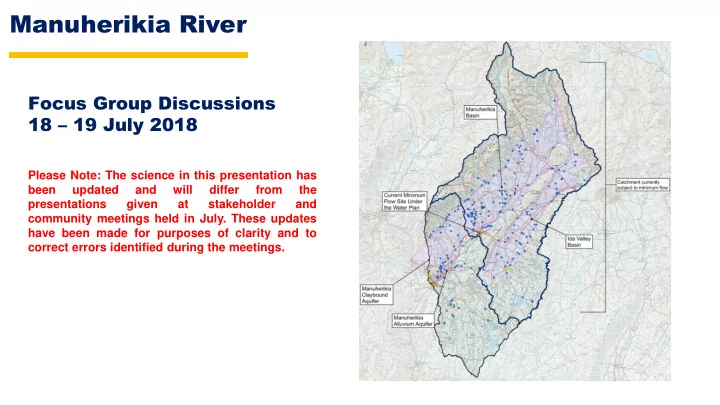
SLIDE 1 Manuherikia River
Focus Group Discussions 18 – 19 July 2018
Please Note: The science in this presentation has been updated and will differ from the presentations given at stakeholder and community meetings held in July. These updates have been made for purposes of clarity and to correct errors identified during the meetings.
SLIDE 2 Why we are doing this plan change?
The Water Plan and the NPSFM require us to set minimum flows
- To safeguard life supporting capacity, ecosystem processes and indigenous species.
- A minimum flow will:
- Provide a management regime that will look after the values of a river during periods of low flow.
- Low flow periods pose a “crunch time” for aquatic ecosystems as habitat and food availability for many
aquatic organisms tends to decrease.
The values that a minimum flow will support in the Manuherikia are:
- Recreation i.e. swimming particularly in the lower reaches
- Trout habitat, Manuherikia is a regionally significant fishery
- Long fin eel, this is a specific cultural value
- Water use for irrigation
- Natural Character
Manuherikia River
SLIDE 3
SLIDE 4 Manuherikia River
Perennial river that would flow all year round irrespective of the influence
SLIDE 5
Manuherikia catchment – vital stats
▪ 3,033 km2 ▪ Dominated by pasture grassland, tussock grasslands at high altitudes ▪ Lowest rainfall in NZ ▪ Valley floor: 300-500 mm/y ▪ 2 flow sites – Ophir & Campground (voluntary)
SLIDE 6
Water takes
▪Heavily allocated
▪>200 SW takes ▪32 m3/s (c.f. default ~ 2 m3/s) ▪Actual max use ~16 m3/s (favourable conditions) ▪Storage ▪Races ▪Takes & re-takes
SLIDE 7 Hydrology
▪Ophir Existing MALF ~2.197 m3/s Naturalised MALF ~3.2 m3/s (±0.6) ▪Campground Existing MALF ~0.915 m3/s Naturalised MALF ~3.9 m3/s (±0.8)
Existing MALF at Ophir corrected
SLIDE 8
Tributaries
▪ Flow at bottom + upstream take ▪ Limited take records ▪ Some takes missing ▪ Provides under estimate Added context: Unless water is taken twice
SLIDE 9 2017 Thomsons Creek March 2016 2018 – from the rail trail
SLIDE 10
Dunstan Creek
▪ Nine water takes ▪ Average monthly water use 2013 – 2017 is 570l/s
SLIDE 11 2010 2012 2014 2016 2018 0.0 0.2 0.4 0.6 0.8 1.0
Actual total water use for Dunstan Creek at Beattie Road
Rate in m3/s
2008-09-18 ~ 2018-05-27
2010 2012 2014 2016 2018 0.0 0.2 0.4 0.6 0.8
Actual to the consented
Ratio (0~1)
2008-09-18 ~ 2018-05-27
Pattern of water use
Added context: the flat top take patterns from before 2014 indicate paper records opposed to digital water metering. Not a doubling in take.
SLIDE 12 Dunstan Creek flow statistics (Naturalised flows - at Beattie Road)
02/03 04/05 06/07 08/09 10/11 12/13 14/15 16/17
Obs (red) vs. Nat (blue) 7dLF variation @ Dunstan Creek at Beattie Road
Flow m
3 / s
0.0 0.2 0.4 0.6 0.8 1.0
MALF16 seasons = 0.295 m
3 / s
MALF10 seasons = 0.743 m
3 / s
Added context: Water is double accounted in these figures, this will be addressed in the CHES model
SLIDE 13 Dunstan Creek flow statistics
(Natural flows – Gorge site)
Added context: Water is double accounted in these figures, this will be addressed in the CHES model
SLIDE 14 Dunstan Creek flow statistics
Added context: Water is double accounted in these figures, this will be addressed in the CHES model
SLIDE 15
Minimum flow options
▪ Minimum flow range 0.400 mᶟ/s – 0.600 mᶟ/s Values Central Otago roundhead galaxias Brown trout Rainbow trout “Dunstan Creek is categorised as a back country fishery containing both brown and rainbow trout”
SLIDE 16
Habitat modelling for brown trout
SLIDE 17 Habitat modelling for brown trout
Species Optimum flow (m3/s) Flow below which habitat rapidly declines (m3/s) Flow at which % habitat retention occurs (m3/s) 70% 80% 90% Compared to naturalised flows Brown trout adult 0.35 0.25 0.339 0.398 0.483 Brown trout yearling 0.30–0.45 0.2 0.067 0.087 0.113 Brown trout spawning 0.35–0.50 0.25 0.153 0.168 0.183
>700
Added context: Optimum flow for brown trout corrected due to typographical error in report.
SLIDE 18 Summary
Dunstan Creek CO roundhead galaxias All year Nationally endangered 90% 0.034
Brown trout All year Regionally significant† 80% 0.398
Rainbow trout All year Regionally significant† 80% 0.753
All year Life-supporting capacity 80% 0.528
All year Life-supporting capacity 80% 0.404 0.050 Long filamentous algae Summer Nuisance <150% 0.453
Season Significance Suggested level of habitat retention Flow to maintain suggested level of habitat retention Flow below which habitat rapidly decline s (m3/s)
SLIDE 19 Flow duration curve
Added context: Water is double accounted in these figures, this will be addressed in the CHES model
SLIDE 20
Lauder Creek
▪ 16 water takes ▪ Average monthly water use 2013 – 2017 was 487l/s
SLIDE 21 Pattern of water use
Added context: the flat top take patterns from before 2014 indicate paper records
- pposed to digital water
- metering. Not a doubling in
take.
SLIDE 22 Lauder Creek flow statistics
(Naturalised flows at the Rail Trail)
Added context: Water is double accounted in these figures, this will be addressed in the CHES model
SLIDE 23 Lauder Creek flow statistics
Added context: Water is double accounted in these figures, this will be addressed in the CHES model
SLIDE 24 Lauder Creek flow statistics
(Natural flows – Cattle Yards)
Added context: Water is double accounted in these figures, this will be addressed in the CHES model
SLIDE 25
Lauder Creek concurrent gauging's
SLIDE 26
Results of the gauging’s (To date)
SLIDE 27
Thomsons Creek
▪ 18 water takes ▪ Average monthly water take 2013 – 2017 was 407l/s
SLIDE 28 Added context: the flat top take patterns from before 2014 indicate paper records opposed to digital water metering. Not a doubling in take.
SLIDE 29 Thomsons Creek flow statistics
(Naturalised flows at SH85)
Added context: Water is double accounted in these figures, this will be addressed in the CHES model
SLIDE 30 Thomsons Creek flow statistics
Added context: Water is double accounted in these figures, this will be addressed in the CHES model
SLIDE 31
Thomsons Creek flow statistics
(Natural flows at the diversion weir)
SLIDE 32
Chatto Creek
▪ 7 water takes ▪ Average monthly water use 2013 – 2017 was 361 l/s
SLIDE 33 Patterns of use
Added context: the flat top take patterns from before 2014 indicate paper records opposed to digital water metering. Not a doubling in take.
SLIDE 34 Chatto Creek flow statistics
Added context: Water is double accounted in these figures, this will be addressed in the CHES model
SLIDE 35 Chatto Creek flow statistics
Added context: Water is double accounted in these figures, this will be addressed in the CHES model
SLIDE 36 Added context: Water is double accounted in these figures, this will be addressed in the CHES model
SLIDE 37 Added context: Water is double accounted in these figures, this will be addressed in the CHES model
SLIDE 38 Manuherikia River
Perennial river that would flow all year round irrespective of the influence
SLIDE 39 Manuherikia River (main-stem)
Added context: Water is double accounted in these figures, this will be addressed in the CHES model
SLIDE 40 The lowest flow scenario 2017 -18
Chatto Creek 0.390 mᶟ/s Thomsons Creek 0.310 mᶟ/s Lauder Creek 0.220 mᶟ/s Dunstan Creek 0.407 mᶟ/s Fork flow recorder 0.570 mᶟ/s 0.280 mᶟ/s Flows at Camping ground 0.968 – 1.013 mᶟ/s Ophir flow recorder 1.669 mᶟ/s Date 31/1/2018 Added context: Water is double accounted in these figures, this will be addressed in the CHES model
SLIDE 41 Minimum flow options
▪ Proposed minimum flow ▪ Ophir: 1500-1750 ▪ Campground: 1250-1600 ▪ Dunstan: 400-600 ▪ Naturalised 7-d MALF ▪ Ophir: 3200 (±600)
▪ Observed: 2500
▪ Campground: 3900(±800)
▪ Observed: 915
SLIDE 42
Upper Manuherikia (1500-1750)
Values ▪ Regionally significant brown trout fishery ▪ Native fishery ▪ Natural character ▪ Birds
SLIDE 43
Instream habitat modelling for brown trout
SLIDE 44 Habitat modelling for brown trout
Species Optimum flow (m3/s) Flow below which habitat rapidly declines (m3/s) Flow at which % habitat retention occurs (m3/s) 70% 80% 90% Compared to existing flows Brown trout adult >6.0
1.214–1.536 1.363–1.742 Brown trout yearling >6.0 1.0 0.423–0.459 0.587–0.736 0.951–1.192 Brown trout spawning 2.0 1.0 0.831–0.854 0.943–0.968 1.166–1.252 Compared to naturalised flows Brown trout adult >6.0
1.410 1.591 Brown trout yearling >6.0 1.0 0.445 0.679 1.087 Brown trout spawning 2.0 1.0 0.845 0.959 1.218
SLIDE 45 Summary
Value Season Significance Suggested level of habitat retention Flow to maintain suggested level
Flow below which habitat rapidly declines (m3/s) (m3/s) Naturalised Existing Upper Manuherikia Brown trout All year Regionally significant† 80% 1.410 1.214–1.536 1.000 Food producing All year Life-supporting capacity 80% 1.311 1.163–1.404 2.000 Long filamentous algae Summer Nuisance <150% 0.782 0.577–0.912
SLIDE 46
Brown trout instream habitat modelling (naturalised flows )
Ophir (mᶟ/s) ▪ 0.820 provides 15% habitat retention ▪ 1.5 provides 35% habitat retention ▪ 1.75 provides 40% habitat retention
SLIDE 47
Flow duration curve
SLIDE 48 Lower Manuherikia (1250 – 1600)
▪ Regionally significant brown trout fishery ▪ Native fish ▪ Natural character ▪ Recreation
SLIDE 49
Instream habitat modelling for brown trout
SLIDE 50 Instream habitat modelling for brown trout
Species Optimum flow (m3/s) Flow below which habitat rapidly declines (m3/s) Flow at which % habitat retention occurs (m3/s) 70% 80% 90% Compared to existing flows Brown trout adult 4.50 3.00 0.636 0.711 0.782 Brown trout yearling 1.50–2.00 1.00 0.316 0.419 0.534 Brown trout spawning 1.00–2.00 1.00 0.485 0.576 0.671 Compared to naturalised flows Brown trout adult 4.50 3.00 2.292 (2.074–2.324) 2.652 (2.357–2.693) 3.107 (2.686–3.172) Brown trout yearling 1.50–2.00 1.00 0.451 (0.494–0.415) 0.594 (0.674–0.528) 0.776 (0.903–0.694) Brown trout spawning 1.00–2.00 1.00 0.415 (0.475–0.369) 0.471 (0.548–0.417) 0.532 (0.627–0.466)
SLIDE 51 What do the proposed options provide
3.14 90
Flows mᶟ/s % Habitat retention for brown trout
0.782 16 0.900 20 1.250 32 1.600 45 2.652 80
SLIDE 52 Instream habitat modelling for longfin eel
1.250
SLIDE 53 Habitat modelling for longfin eel
Species Optimum flow (m3/s) Flow below which habitat rapidly declines (m3/s) Flow at which % habitat retention
60% 70% 80% 90% Compared to existing flows Longfin eel >300 mm 1.75 1.00 0.242 0.348 0.468 0.664 Upland bully 0.50 0.25 0.130 0.159 0.187 0.216 Compared to naturalised flows Longfin eel >300 mm 1.75 1.00 0.288 (0.292– 0.245) 0.419 (0.423– 0.359) 0.592 (0.600– 0.481) 0.850 (0.862– 0.691) Upland bully 0.50 0.25 0.072 (0.082– 0.055) 0.091 (0.103– 0.071) 0.110 (0.124– 0.087) 0.128 (0.145– 0.103)
SLIDE 54 Natural character
Photo 3/3/2016
Flows at Camping–ground 1.021mᶟ/s
SLIDE 55 Taken a month a part Summer 2015
SLIDE 56 Value Season Significance Suggested level of habitat retention Flow to maintain suggested level of habitat retention Flow below which habitat rapidly decline s (m3/s) (m3/s) Naturalised Existing Upper Manuherikia Brown trout All year Regionally significant† 80% 1.410 1.214– 1.536 1.000 Food producing All year Life-supporting capacity 80% 1.311 1.163– 1.404 2.000 Long filamentous algae Summer Nuisance <150% 0.782 0.577– 0.912
Brown trout All year Regionally significant† 80% 2.652 (2.357– 2.693) 0.782 3.250 Longfin eel All year At risk, declining 80% 0.592 (0.600– 0.481) 0.468 1.000 Food producing All year Life-supporting capacity 80% 2.474 (2.064– 2.862) 0.733
algae Summer Nuisance <150% 2.491 (1.850– 3.381) 0.161
SLIDE 57
Flow duration curve
SLIDE 58 What do the minimum flow options achieve
▪ Ophir
- 1500 l/s, 35% adult trout habitat
- 1700 l/s, 40% adult trout habitat
▪ Camping ground
- 1250 l/s, <50% but, over 50% increase from current adult trout
habitat
- 1600 l/s, <50% but, double from current adult trout habitat
▪ Dunstan Creek
- 400 l/s, 80% adult trout habitat
- 600 l/s, >90% adult trout habitat
SLIDE 59