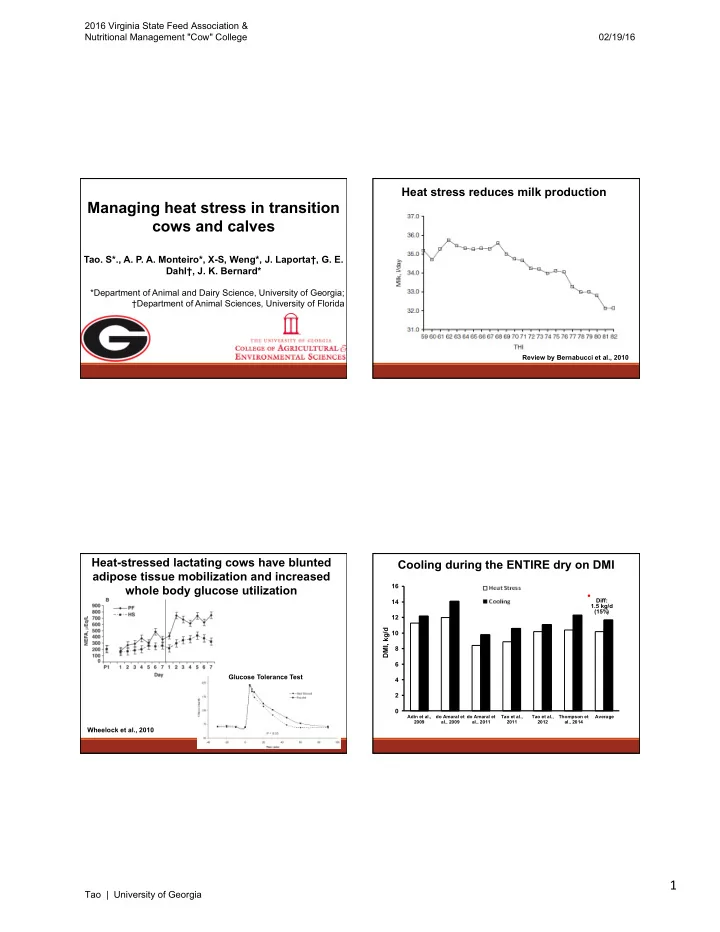
2016 Virginia State Feed Association & Nutritional Management "Cow" College 02/19/16 Heat stress reduces milk production Managing heat stress in transition cows and calves Tao. S*., A. P. A. Monteiro*, X-S, Weng*, J. Laporta†, G. E. Dahl†, J. K. Bernard* *Department of Animal and Dairy Science, University of Georgia; †Department of Animal Sciences, University of Florida Review by Bernabucci et al., 2010 Heat-stressed lactating cows have blunted Cooling during the ENTIRE dry on DMI adipose tissue mobilization and increased 16 whole body glucose utilization Diff: 14 1.5 kg/d (15% ) 12 DMI, kg/d 10 8 6 Glucose Tolerance Test 4 2 0 Adin et al., do Amaral et do Amaral et Tao et al., Tao et al., Thompson et Average 2009 al., 2009 al., 2011 2011 2012 al., 2014 Wheelock et al., 2010 1 ¡ Tao | University of Georgia
2016 Virginia State Feed Association & Nutritional Management "Cow" College 02/19/16 Heat stress doesn’t affect fat mobilization of Heat stress doesn’t affect glucose tolerance dry cows of dry cows Pair-fed early lactating cow -14 d relative to calving HS early lactating cow HS dry cow Pair-fed dry cow Lamp et al., 2015 Heat stress doesn’t affect blood metabolites Heat stress increases protein mobilization of and insulin of dry cows dry cows 14 * 1-/3-Methyl histidine, µmol/L 12 10 8 6 Heat Pair- Heat Pair- stress Fed stress Fed 4 2 0 Dry cow Early lactating cow Adapted from Lamp et al., 2015 2 ¡ Tao | University of Georgia
2016 Virginia State Feed Association & Nutritional Management "Cow" College 02/19/16 Cooling during the ENTIRE dry on milk yield Cooling during the Close-up on milk yield (Multiparous cows) (Multiparous cows) 50 50 45 Diff: 45 Milk Production, kg/d Diff: 4 kg/d Milk Production, kg/d 40 2.2 kg/d (12.2% ) (5.8% ) 40 35 35 30 30 25 25 20 15 20 Wolfenson et al., Avendaño-Reyes Adin et al., do Amaral et do Amaral et Tao et al., Thompson et Tao et al., Thompson et Average al., 2009 al., 2011 2012b 2011 al., 2012 al., 2014 et al., 2006 2009 15 1988 Urdaz et al., 2006 Adapted from Adapted from Karimi et al., 2015 Average Wang et al., 2010 Gomes et al., 2014 Adapted from Tao and Dahl, 2013 Cooling during the late gestation on milk yield Cooling dry cows increases MY (~ 1month, Heifers) Diff: Treatment effect: P < 0.03 27 2.4 kg/d (6.2% ) 25 Milk Production, kg/d 23 21 19 17 15 Adapted from Wang et al., Adapted from Gomes et al., Average Tao et al., 2011 Tao et al., 2011 2010 2014 3 ¡ Tao | University of Georgia
2016 Virginia State Feed Association & Nutritional Management "Cow" College 02/19/16 Heat stress decreases estrone sulfate Cooling improves mammary growth in the late dry period Treatment effect: P < 0.03 -‑20 ¡Day ¡RelaHve ¡to ¡Calving ¡ * ¡ ¡ ¡ P ¡< ¡0.05 ¡ ¡ ¡ * ¡ 4.0 ¡ ** ¡ ¡ P ¡< ¡0.01 ¡ ¡ ¡ ** ¡ 3.5 ¡ Ki67 ¡labeling, ¡% ¡ Shade 3.0 ¡ 2.5 ¡ 2.0 ¡ 1.5 ¡ Heat ¡Stress ¡ Cooling ¡ 1.0 ¡ Non-Shade 0.5 ¡ 0.0 ¡ Epithelium ¡ Stroma ¡ Total ¡ Tao et al., 2011 Collier et al., 1982 Heat ¡Stress ¡May ¡Alter ¡Mammary ¡ Mammary ¡Gland ¡Development ¡During ¡the ¡Dry ¡ InvoluHon ¡in ¡Early ¡Dry ¡Period ¡ Period ¡ ProlacHn ¡ Mammary ¡ ¡ ¡ apoptosis ¡ Heat ¡shock ¡protein ¡ Heat ¡ ¡ stress ¡ Mammary ¡ ¡ Estrone ¡sulfate ¡ autophagy ¡ Mammary ¡ ¡ Mammary ¡ ¡ growth ¡ involuHon ¡ Collier, et al., 1982; 2008; Tao et al., 2011; 2013 4 ¡ Tao | University of Georgia
2016 Virginia State Feed Association & Nutritional Management "Cow" College 02/19/16 Heat stress blunts mammary autophagy during Hypothesis: ¡Heat ¡Stress ¡Impairs ¡Mammary ¡ the early dry period InvoluHon ¡ LC3-I LC3-II LC3-I LC3-II Cooling Heat Stress Day relative to dry off Wohlgemuth et al., 2015 Heat stress impairs IgG responses against Heat stress impairs lymphocyte proliferation ovalbumin challenge Cool Heat Stress 80 Cool 70 60 IgG, O.D. x 103 do Amaral et al., 2011 50 40 30 Heat 20 EC Stress 10 NC 0 Cov -14 3 7 14 21 28 35 42 Day relative to calving Gomes et al., 2014 do Amaral et al., 2011 5 ¡ Tao | University of Georgia
2016 Virginia State Feed Association & Nutritional Management "Cow" College 02/19/16 Calving season on cow health (up to 60 DIM) Heat stress impairs neutrophil function 20 ** Cool 18 ▫ Calving in summer 16 ** ▪ Calving in winter 14 Heat Stress 12 % 10 8 6 † Cool 4 2 Heat 0 Stress Mastitis Respiratory Retained Placenta Metritis Adapted from Thompson and Dahl., 2012 do Amaral et al., 2011 Prepartum cooling increases metritis Prepartum cooling is the key 50 Heat Stress † 43.9 45 q Most effective approach Cooling Metritis Incidence, % 40 35 32.8 30 25 q Slight reduction in body temperature can have 20 strong impact on subsequent lactation 2/74 8/73 39/119 54/123 15 † 11.0 10 5 2.7 0 Exp 1 Exp 2 Adapted from Thompson et al., 2014 6 ¡ Tao | University of Georgia
2016 Virginia State Feed Association & Nutritional Management "Cow" College 02/19/16 Prepartum cooling slightly reduces cow body Reduction in body temperature when dry temperature improves subsequent milk yield 40.0 45 39.8 Milk Production, kg/d 40 Diff: Milk = 483.48 - 11.523 × Temp 39.6 Rectal Temperature, O C 0.4 O C R ² = 0.51, P = 0.001 39.4 35 39.2 30 39.0 38.8 25 38.6 38.4 20 38.2 15 38.0 Wolfenson et al., Avendaño-Reyes Adin et al., do Amaral et do Amaral et Tao et al., Thompson et Tao et al., Average 2012b al., 2009 al., 2011 al., 2014 2009 2011 et al., 2006 10 1988 38.0 38.5 39.0 39.5 40.0 40.5 Rectal Temperature, o C Tao and Dahl, 2013 Adapted from Tao and Dahl, 2013 Summary – Heat stress during the dry period Maternal heat stress on calf on cow q Impairs mammary growth during the dry period q Decreases milk production in the next lactation q Alters metabolic responses during transition q Compromises immune function during transition q Cooling dry cow is the key 7 ¡ Tao | University of Georgia
2016 Virginia State Feed Association & Nutritional Management "Cow" College 02/19/16 Late gestation heat stress affects calf body Late gestation heat stress decreases birth weight weight 400 50 Heat Stress Cooling Diff: 350 Cooling 4.7 kg Calf birth weight, kg Heat Stress 45 (12.5%) 300 trt: P < 0.05 Body Weight (kg) 40 N = 72 250 35 200 30 150 25 100 20 50 15 Collier et al., Wolfenson et et al., 2006 Avendaño- Adin et al., do Amaral et do Amaral et Tao et al., al., 2012 Monteiro et al., Average Tao et 0 Reyes al., 2009 al., 2011 2011 1982b 2009 1988 al., 2012 0 2 3 4 5 6 7 8 9 10 11 12 Months of Age Adapted from Tao and Dahl, 2013 Monteiro et al., 2013 Glucose clearance to glucose infusion Insulin clearance to insulin infusion Day ¡8 ¡ Day ¡29 ¡ Day ¡29 ¡ Day ¡8 ¡ 9 6 200 200 Trt effect: P = 0.16 Trt effect: P = 0.5 8 Trt effect: P = 0.16 Trt effect: P = 0.42 Trt*time effect: P = 0.04 Trt*time effect: P = 0.33 5 180 Trt*time effect: P < 0.01 180 Trt*time effect: P < 0.01 ** P < 0.01, * P = 0.05 7 ** P < 0.01, * P < 0.05 ** P < 0.01, * P < 0.05 Insulin, ng/mL ** Insulin, ng/mL 160 160 6 4 Glucose, mg/dL Glucose, mg/dL Heat Stress Heat Stress 140 140 5 ** * ** Cooling 3 Cooling * 4 120 ** 120 In ¡utero ¡heat-‑stressed ¡calf ¡had ¡ In ¡utero ¡heat-‑stressed ¡calf ¡had ¡ ** 3 2 100 100 * * 2 80 80 1 Heat Stress higher ¡ability ¡to ¡absorb ¡glucose ¡ Heat Stress insulin ¡resistance ¡– ¡less ¡insulin ¡ 1 60 60 Cooling Cooling 0 0 40 40 0 5 10 15 20 30 40 50 60 75 90 120 0 5 10 15 20 30 40 50 60 75 90 120 0 5 10 15 20 30 40 50 60 75 90 120 0 5 10 15 20 30 40 50 60 75 90 120 Time relative to infusion, min mediated ¡glucose ¡entry ¡to ¡Hssue ¡ Time relative to infusion, min Time relative to infusion, min Time relative to infusion, min Day ¡57 ¡ Day ¡57 ¡ 6 200 * Trt effect: P = 0.15 Trt effect: P = 0.02 180 Trt*time effect: P = 0.06 Trt*time effect: P < 0.01 5 * * P = 0.05 , † P < 0.1 ** P < 0.01, * P < 0.05 160 Insulin, ng/mL ** Glucose, mg/dL 4 ** Heat Stress 140 ** Cooling 3 120 * * † 100 * 2 * 80 Monteiro et al., 2015 * Monteiro et al., 2015, † † Heat Stress 1 60 Cooling JAM 0 40 0 5 10 15 20 30 40 50 60 75 90 120 0 5 10 15 20 30 40 50 60 75 90 120 Time relative to infusion, min Time relative to infusion, min 8 ¡ Tao | University of Georgia
Recommend
More recommend