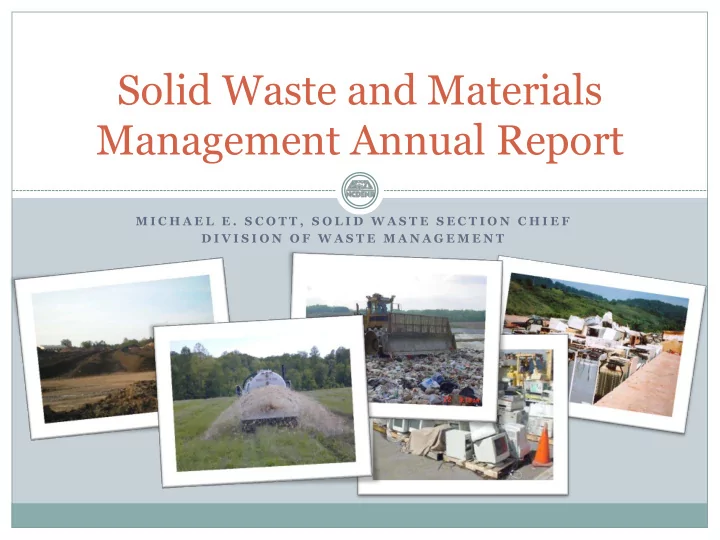

Solid Waste and Materials Management Annual Report M I C H A E L E . S C O T T , S O L I D W A S T E S E C T I O N C H I E F D I V I S I O N O F W A S T E M A N A G E M E N T
Waste types handled: Solid Waste municipal solid waste Section industrial waste Regulates safe management of solid construction and demolition waste through technical waste assistance, regulations, permitting, environmental land-clearing waste monitoring, compliance evaluation and scrap tires enforcement. medical waste compost septage electronics
North Carolina communities Disposal Facts disposed of 9,467,045 tons of waste Waste Disposal in Increase of 71,588 tons from the N.C. previous fiscal year 6% State capacity equals 29 years of 24% waste disposal (if the municipal 59% 11% solid waste disposal rate remains at 7.6 million tons per year) Municipal Solid Waste Landfill Construction & Demolition Landfill Industrial Landfill Land Clearing and Inert Debris Landfill
Municipal Solid Waste 40 municipal • landfills 1 municipal • incinerator Subtitle D • requirements Disposal rates • Landfill liner installation
Number of Open Municipal Solid Waste Landfills in N.C. 140 120 100 80 Number of Facilities 60 40 20 0 1990 1991 1992 1993 1994 1995 1996 1997 1998 1999 2000 2001 2002 2003 2004 2005 2006 2007 2008 2009 2010 Year Unlined Lined
North Carolina Solid Waste Disposal 20-Year Forecast 16,000,000 15,659,003 ACTUAL FORECAST 15,000,000 FY2010-2011 9,467,045 tons 14,000,000 population 9,586,227 13,000,000 12,354,907 Population / Tons Disposed 12,000,000 11,000,000 10,000,000 9,000,000 8,000,000 Waste Disposed Population 7,161,455 7,000,000 6,632,448 6,000,000 1991 1992 1993 1994 1995 1996 1997 1998 1999 2000 2001 2002 2003 2004 2005 2006 2007 2008 2009 2010 2011 2012 2013 2014 2015 2016 2017 2018 2019 2020 2021 2022 2023 2024 2025 2026 2027 2028 2029 2030 2031
Wastesheds and MSWLF Capacity
Import and Export of Solid Waste (tons) 1,400,000 1,200,000 1,000,000 800,000 Tons 600,000 400,000 200,000 0 FY 1997- FY 1998- FY 1999- FY 2000- FY 2001- FY 2002- FY 2003- FY 2004- FY 2005- FY 2006- FY 2007- FY 2008- FY 2009- FY 2010- 1998 1999 2000 2001 2002 2003 2004 2005 2006 2007 2008 2009 2010 2011 Imports 87,393 74,185 41,840 21,614 117,981 144,116 108,803 119,202 137,307 129,906 145,551 139,446 213,323 181,537 Exports 629,415 1,166,875 1,106,897 900,743 882,247 971,286 1,048,111 1,161,926 1,234,307 1,329,202 1,069,428 863,604 788,834 618,017
Composting Growing sector in Solid Waste 40 Solid Waste compost facilities Food waste, agricultural byproducts, and sludges are managed 64,000 tons of food waste and food residuals composted in FY 2010-2011 Large Type III Compost Facility in Goldston, NC
Septage Solid waste that is a fluid mixture of untreated and partially treated sewage solids of human or domestic origin. Septic tank waste Grease traps Portable toilets 505 septage firms Septage dewatering facility in Craven Co
Septage Pumped Per Year 120 100 80 Gallons (in millions) 60 40 20 0 1997 1998 1999 2000 2001 2002 2003 2004 2005 2006 2007 2008 2009 2010 Domestic Grease Portable Toilet Waste
Medical Waste Waste primarily managed in incinerators and autoclaves Treated waste may then Tons Managed at NC Facilities be disposed of in 40,000 landfills 35,000 30,000 25,000 Tons 20,000 15,000 10,000 5,000 0 FY 2006-2007 FY 2007-2008 FY 2008-2009 FY 2009-2010 FY 2010-2011
Electronics Session law 2010-67 63% increase in electronics tonnage from FY2009-10 Overall Recycling of Electronics (tons) FY11 Manufacturer Televisions (non-local government collections) 1,754.23 Manufacturer Computer Equipment (non-local government collections) 2,895.82 Local Government Televisions 3,019.39 Local Government Other Electronics 4,432.15 TOTAL 12,101.59 Total Pounds Per Capita 2.5
Scrap Tires 122,206 tons , managed by counties and shipped to two NC processing firms 1,508 tons , managed by counties and shipped to out-of-state processors 28,292 tons , tires taken directly to processing firms (privately-funded cleanups or tire dealers not participating in a county program) ___________ 152,006 tons =Total tires from citizens of North Carolina
White Goods Refrigerators, ranges, stoves, etc. Can be difficult to dispose of Cost overrun grants by grant period Can contain $1,000,000.00 chlorofluorocarbon $900,000.00 $800,000.00 refrigerants $700,000.00 $600,000.00 $500,000.00 Some NC counties will $400,000.00 continue to need $300,000.00 $200,000.00 support for their $100,000.00 programs $0.00
Disaster debris sites Disaster Response 2011 tornadoes and Hurricane Irene Staff on call 24/7 Solid Waste interactive map available on website Primarily managing disaster debris 346 sites in NC 74 new sites in 2011 Hurricane Irene
More information available on web at: http://portal.ncdenr.org/web/wm/sw Or contact: Michael E. Scott, Section Chief Division of Waste Management – Solid Waste Section 1646 Mail Service Center Raleigh, NC 27699-1646 Phone: (919) 707-8246 Email: michael.scott@ncdenr.gov
Recommend
More recommend