
SLIDE 1
Making Waste Productive Creating Energy from Waste Creating Energy - - PowerPoint PPT Presentation
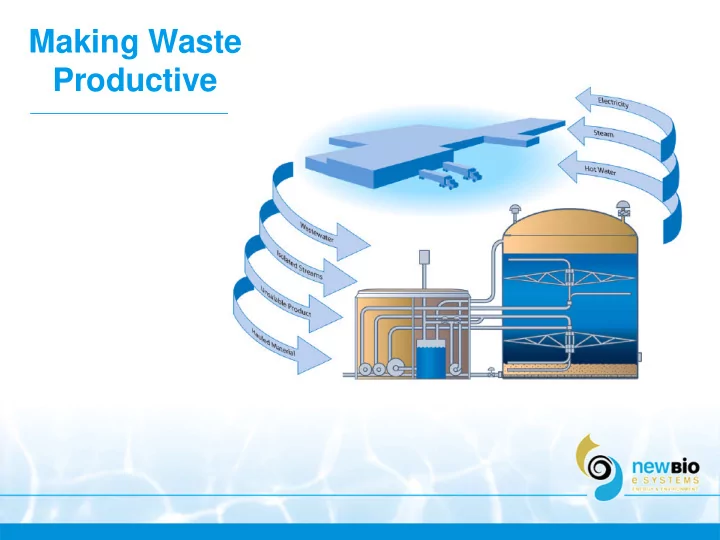
Making Waste Productive Creating Energy from Waste Creating Energy Inputs from Current Waste Outputs ? Organic material ( waste ) can be converted into energy ( methane) through a process called anaerobic digestion ? Applications where waste
Cheese plants Snack Food plants Prepared Food plants
Ethanol plants Biodiesel plants
? The energy value of a waste stream is measured in pounds of chemical oxygen demand (COD) ? Every pound of COD digested results in 5.6 cubic feet of methane ? An effective anaerobic digester usually converts 95+% of the available COD into methane ? Every cubic foot of methane produces around 1,000 BTU’s of energy
? Approximately 5,600 BTUs in a pound of COD
? A pound of organic solids will contain around a pound of COD ? A truck load of solids can contain around 50,000 pounds of COD
? Energy potential to power a 1 MW generator on a continuous basis
Clarifiers Screens All types of filtration and dissolved air flotation devices
Conversion of organic material
Raw input material: Fats, Oils, proteins, starches, carbohydrates, sugars
Digester
Acetogenic bacteria break complex food molecules down to produce Carbon dioxide and Acetic Acid Methanogenic bacteria break acetic acid down to produce Methane
Acetic Acid
Carbon Dioxide Methane: 5.6 ft3/ lb COD
Discharge: >95% COD Removal 99% BOD Removal Biomass accumulation: ~1% of Aerobic rate
pH Adjustment Temperature Control
? STEP ONE: Data evaluation, using existing plant data
Estimate the effectiveness technology to generate energy in the form of methane gas
? STEP TWO: Lab evaluation, using actual samples of plant residuals and organic waste
Determine parameters, limits and potential quantities of methane gas generation
? STEP THREE: Demonstration project
Test the design parameters on waste residuals to finalize the optimum factors for a full-scale plant
Confirmed plant waste quantities Sampled each waste stream (packed on ice)
? By geography: (1) Study with MN Power ? Results ? Feasible dedicated plants (with reasonable timeliness for ROI ? A regional cogeneration plant would treat all of these manufacturers ? The potential waste streams from the other facilities do not generate enough energy to make dedicated plants or a cogeneration facility economically feasible
Lbs/COD/day BTU Value KW Equivalent TOTALEnergy Value Snack Food Manufacturer 26,000 lb/day 140 MM BTU/day 550 kW/hr 2.3 MM BTU/hr Liquid Egg Manufacturer 4,800 lb/day 26 MM BTU/day 100 kW/hr 0.4 MM BTU/hr Dry Egg Manufacturer 1,500 lb/day 8.3 MM BTU/day 32 kW/hr 0.13 MM BTU/hr Beef and Port Repacking Plant 620 lb/day 3.5 MM BTU/day 13 kW/hr 0.06 MM BTU/hr
Confirmed plant waste quantifies Sampled each waste stream (packed on ice)
? Results
? Completed demonstration project on cheese manufacturing plant ? Cheese manufacturer can sustain full plant Can increase energy by processing waste from other regional plants
Lbs/COD/day BTU Value kW Recoverable Heat Byproducts Plant Data not available Poultry Byproducts (dead stock rendering) Plant 6,250 lbs/day 35 MM BTU/day 135 kW/hr 0.6 MM BTU/hr Egg Processor 4,000 lbs/day 22.4 MM BTU/day 86 kW/hr 0.35 MM BTU/hr Dairy 5,250 lbs/day 29 MM BTU/day 110 kW/hr 0.48 MM BTU/hr Dairy 13,500 lbs/day 76 MM BTU/day 290 kW/hr 1.2 MM BTU/hr Cheese Processor 56,300 lb/day 315 MM BTU/day 1,200 kW/hr 5.1 MM BTU/hr
? Permeate stream
COD concentration averaged 52,000 mg/l
? Recovery of whey protein concentrate ? Recovery of lactose ? Treatment of 350,000 gallons per day of waste in plant-owned treatment plant
Trucked 6,000 gallon of waste from WPC and lactose recovery process
50 lbs of feed COD/1000 gallons of digester liquid volume
Average COD strength of 53,000 mg/l Ramped up until the target feed rate of 300 lbs COD/day (50 lbs/1000 gallons
? Test history: COD
? Operating at design capacity on permeate
? Test history: methane production
? Relatively steady Flow dropped when the gas flow was shut down to clean the gas discharge line of accumulated moisture
? Test history: methane flow per unit of COD removed
? Consistently within the projected flow rate of 5.6 cubic feet of methane/lb of COD
? Test history: BOD
? Virtually the entire BOD available has been consumed in the digester
? Test history: alkalinity
? Stable; most of the alkalinity is retained in the digester, conserving chemical
? Test history: calcium (needed for growth)
? Sufficient quantities; supplemental calcium is not required
? Test history: hydrogen sulfide
? A contaminant in the gas could cause operational difficulties in high concentrations; data inconclusive
? Test history: solids—TS, VS, TSS, VSS
? TSS-No accumulation of total suspended solids
? Test history: Methane and CO2 Production
? Bag samples were collected to verify the accuracy of the on-line instruments that measure COD and methane (two manufacturers = 4 instruments)
? Test history ? summary ? Conversion of the dairy permeate to energy is straight forward and achievable
Digester operated in a stable fashion No accumulation of COD in the digester Converted 98 percent of the COD (>99% of the BOD) to energy Gas production met the design value of 5.6 cubic feet of methane/lb of COD removed
? 80% to 100% of gas demand ? 1 MW power output plus heat recovery
? Demonstration project completed ? Final plant design
? Option A assumes the addition of a co-generation unit and the recovery of heat from that unit ? Option B assumes that the biogas is only burned in existing boilers ? Both options assume the biogas plant is NewBio’s property and the biogas utilization equipment is the client’s property
? No “Green Credits” included
? Project timeline: 9-22-04 to 12-13-04 ? Cooperative effort between the food processor, the Ohio Agricultural Research and Development Center (OARDC), Center for Innovative Food Technology (CIFT), and NewBio E Systems Inc. ? 5 waste streams ? One (starch) being sold for profit
Stream Description COD Strength Material Generated Per Day Pounds COD Generated Per Day Mash/Belt press solids (compressed) 346,000 mg/kg 244,000 mg/kg 443,000 mg/kg 23,000 lbs 7,929 lbs Finished corn 1,090,000 mg/kg 1,010,000 mg/kg 998,000 mg/kg 7,800 lbs/day 8,064 lbs Finished potato 1,260,000 mg/kg 1,440,000 mg/kg 1,460,000 mg/kg 7,800 lbs/day 10,828 lbs Clarifier water at effluent tank2 2,020 mg/l 1,490 mg/l 2,370 mg/l 400,000 gallons 6,536 lbs
? Hauling 1 to 2 truckloads a day of solids for processing into animal feed ? Discharging effluent from plant’s pretreatment equipment to local POTW
? Replicate a full-scale loading rate
50 to 60 lbs COD/1000 gallons of digester volume
? Determine COD Removal Efficiency: goal 90% ? Determine optimum factors for a full-scale plant
? The actual quantity and quality of gas produced per pound of COD destroyed ? TSS and VSS ? The gas ratio of methane (CH4) in the biogas, to carbon dioxide (CO2) ? Mass balance FOG (Fat, oils, grease) ? Base addition—Chemical supplementation is required to maintain a neutral pH under actual operating conditions ? How system components interact with waste streams
? Samples collected at five locations in the system
The feed The discharge Three locations within the digester
? Gas samples
Collected by OARDC and analyzed via GC Collected by NewBio and tested for CO2 and CH4 by an independent lab using EPA method SW846
– Verified that the continuous gas analyzer on the pilot provided accurate results – Methane concentration in the gas discharge was consistently between 70% and 75%
During a biomass growth mode overall gas production was two to four times higher using trace metals to supplement than without
? Test history: COD
? Data showed that approximately 91% to 98% (average 95%) of feed COD is reduced in the system
COD Sample Date Lab EQ Tank Digester 2 ft Digester 4 ft Digester 6 ft Effluent Units 11/23/2004 Test Lab 1 51,200 39,000 38,500 33,500 4,710 mg/l 11/23/2004 NewBio 54,900 40,000 34,300 33,600 3,080 12/2/2004 Test Lab 1 65,600 30,600 34,100 36,400 2,420 12/2/2004 NewBio 38,300 35,600 32,300 34,200 2,060 12/7/2004 Test Lab 1 48,300 39,800 32,100 28,800 1,150 12/7/2004 Test Lab 2 33,869 49,997 37,440 29,606 2,074 12/7/2004 NewBio 40,600 35,200 35,100 34,900 1,240 12/8/2004 Test Lab 1 37,700 42,200 32,200 37,200 2,320 12/8/2004 Test Lab 2 33,085 36,680 36,311 35,205 1,106 12/8/2004 NewBio 32,500 27,400 28,400 31,800 1,290 12/9/2004 Test Lab 2 44,421 34,007 35,942 33,638 1,115 12/9/2004 NewBio 41,200 37,600 36,600 30,900 1,670 12/13/2004 Test Lab 2 30,781 59,075 41,933 54,374 1,475 12/13/2004 NewBio 39,100 22,600 14,600 26,000 2,800 12/14/2004 Test Lab 2 38,080 35,680 41,280 40,920 1,840 12/14/2004 NewBio 35,000 31,900 35,500 44,900 1,720
? Test history: TS and TSS
? Data indicated most of the COD is contained in the total and suspended solids, and very little COD appears to be associated with the dissolved solids
Total Solids (TS) Sample Date Lab EQ Tank Digester 2 ft Digester 4 ft Digester 6 ft Effluent Units 12/2/2004 Test Lab 1 NA 33,100 30,900 31,000 NA mg/l 12/7/2004 Test Lab 1 20,000 31,900 30,500 26,800 6,530 12/7/2004 Test Lab 2 20,261 124,856 31,308 32,622 6,781 12/8/2004 Test Lab 1 22,700 32,600 27,800 26,600 6,820 12/8/2004 Test Lab 2 22,267 33,411 31,257 29,641 6,922 12/9/2004 Test Lab 2 22,187 33,834 36,734 30,894 7,033 12/13/2004 Test Lab 2 21,593 37,300 33,930 31,531 6,340 12/14/2004 Test Lab 2 21,515 35,270 32,300 30,500 6,500
? Test history: VS/VSS ? Analysis indicated that essentially 100% of the solids in the feed stream are volatile ? The VS/VSS ratio is further indication (that the energy availability from the suspended solids is very different than the energy availability from the dissolved solids 85% to 95% of the total energy availability in the feed stream is in the suspended solids and not in the dissolved solids
? Test history: VS/VSS
Volatile Solids (VS) Sample Date Lab EQ Tank Digester 2 ft Digester 4 ft Digester 6 ft Effluent Units 12/2/2004 Test Lab 1 NA 21,800 21,900 22,100 NA mg/l 12/7/2004 Test Lab 1 16,900 20,800 21,200 19,700 3,100 12/7/2004 Test Lab 2 17,370 21,058 23,188 24,413 3,362 12/8/2004 Test Lab 1 19,200 21,200 19,800 19,700 3,290 12/8/2004 Test Lab 2 18,884 22,175 22,275 22,828 3,504 12/9/2004 Test Lab 2 19,115 22,722 23,118 23,225 3,547 12/13/2004 Test Lab 2 18,726 23,940 23,940 23,838 3,508 12/14/2004 Test Lab 2 18,865 23,500 23,370 23,500 3,435
? Test history: oil and grease
? Analysis indicates that essentially all (98%) of the oil and grease in the feed stream is converted to energy in the digester; no FOG accumulation
Oil & Grease Sample Date Lab EQ Tank Digester 2 ft Digester 4 ft Digester 6 ft Effluent Units 11/23/2004 Test Lab 1 1,420 42.8 109 70 18 mg/l 12/2/2004 Test Lab 1 1,480 81.5 55.3 44.8 < 20 12/7/2004 Test Lab 1 1,000 30 22 18 <20 12/7/2004 Test Lab 2 1,116 343 180 183 <3 mg/kg 12/8/2004 Test Lab 1 606 57 54 48 <20 12/8/2004 Test Lab 2 1,155 140 213 297 4 12/9/2004 Test Lab 2 988 333 433 303 <3 12/13/2004 Test Lab 2 1,100 417 250 330 7 12/14/2004 Test Lab 2 999 560 403 330 <3
? Test history: chemical parameters ? Alkalinity—Despite little additional base required to maintain pH, the alkalinity in the digester was roughly double the alkalinity in the feed stream
This is an indication that the proteins in the feed line are being successfully broken down in the digester
? Volatile Acids—Test data indicates that the feed material has very high volatile acid concentrations, simplifying the chemical process, since these can be directly cleaved by the methane formers to form methane
The data also indicates that most of the available food is being digested, and that the biomass population in the pilot is adequate to convert the waste stream to energy at the operational food to mass ratio
? Test history: chemical parameters ? Nitrogen—The TKN and ammonia values provide a first estimate of the organic nitrogen in the system and thus a rough indication of the amount of protein in the system. The process of degrading proteins to base can significantly reduce the quantity of supplemental base required
TKN values stayed relatively constant in the EQ tank, and dropped over time in the effluent. This is consistent with theory, and with the alkalinity data showing increase in alkalinity in the digester
? Phosphorous—The fact that effluent phosphorous is approximately the same as the influent phosphorous indicates that the biomass has adequate phosphorous to grow. ? Sodium—Sodium results show that the feed materials and the sodium concentration in the digester do not approach sodium toxicity level of 5,000 mg/l
? Test history ? summary ? Conversion of the manufacturer’s waste materials to energy is straight forward and achievable Digester operated in a stable fashion No accumulation of biologically toxic materials, such as oil and grease or sodium were observed in the digester The solids content encountered (4% to 5%) was easily pumpable, and did not cause any operational problems The NewBio BioAccelerator™ digester operated at the average loading rate of 57 lbs feed COD per 1,000 gallons reactor volume, or 29,000 lbs per COD per day at the planned reactor size
? Test history ? summary ? Conversion of the manufacturer’s waste materials to energy is straight forward and achievable
Converted 95 to 98 percent of the COD (>99% of the BOD) to energy Gas production met the design value of 5.6 cubic feet of methane/lb of COD removed
? The study proved conclusively that a New Bio’s technologies can take solids with high amounts of suspended solids and oils, and recover energy in useable amounts
Based on the results of the demonstration project, up to 550kw of electricity can be generated from the residual solids plus an additional three decatherms per hour of useful hot water and steam